The influence of the medium on the infrared spectrum of self-associated systems. A structural analysis
Michail G Arnaudov
University of Sofia,
Department of Chemistry,
1, James Bourchier Str.,
1164 Sofia, Bulgaria
E-mail: Marnaudov [at] chem.uni-sofia.bg
Keywords
IR-spectral analysis, dichroic IR-spectra, 2-aminopyridine self-associates
Abstract
The infrared (IR) spectrum of a substance is effected by the medium in which it is phased. We illustrate this in the case of 2-aminopyridine (2-AP) as a model. A comparative study of the intermolecular interactions of the 2- and 3-aminopyridine (3-AP) in non-polar (carbon tetrachloride and chloroform) solvents and in condensed state is reported. The presence of chain-like self-associates in solution is proved and is in contrast to the crystalline structure of 2-AP where the stabilization of cyclic dimers takes place. These conclusions are confirmed by means of a linear-dichroic infrared (IR-LD) spectral analysis of 2-AP dissolved and oriented in a nematic liquid crystal as well as of an oriented polycrystalline 2-AP sample. The possibilities of the so-called “stepwise reduction procedure” applied to the polarized and unpolarized IR-spectra are demonstrated. The discussed investigation point out some methodical IR-spectral analysis priorities for structural investigation of complex organic systems such as hydrogen bonded associates, coordination compounds etc.
Introduction
The wide availability of relatively cheap spectrometers production for the middle IR-region has gradually reduced the IR-spectral analysis to a routine procedure for the structural characterization of the organic compounds. A generally shared view requires that IR-spectroscopy can give information in advance, based on the characteristic frequencies that can confirm (or reject) results obtained by organic syntheses. A range of conventional techniques for the measurement of the spectra are available both in solvents or in condensed state.
In reality, traditional methods in IR spectroscopy possess more analytical possibilities than are illustrated by the normal application to structural investigation of the organic compounds. These more sophisticated studies are usually connected with a variety of experimental procedures e.g., variation of solvent or phase and comparison between the results obtained. It is possible also to apply more specific techniques, e.g., the study of orientated samples in the solid state and the investigation of their polarized IR-spectra.
The current study illustrates the application of these methods to the IR-structural analysis of the self-associates of 2-aminopyridine (2-AP). The choice of subject was influenced by the assumption that in non-polar solution 2-AP forms chain-like self-associates whilst in contrast in the solid state stable cyclic dimers are found.
Comparative IR-spectral analysis [1]
The present investigation demonstrates the traditional application of IR-spectroscopy to a structural analysis based on data obtained by changing solute concentration or the phase of the compound as well as by comparing the IR-spectra of similar compounds. This approach makes it possible to follow the transformation caused by the effects of association, complexation etc. The method is effective especially useful in the characterization of substances which cannot be studied by X-ray diffraction .
IR-spectral studies of 2-AP including a normal coordinate treatment [2, 3] have been reported by a great number of authors [4-12], but detailed analysis of hydrogen bond formation has not been worked upon. As a result of X-ray diffraction [13], stabilization of the cyclic dimers (Scheme (1)) is assumed not only in the solid state, but also in solution [14, 15]. However, some peculiarities intrinsic to the IR-spectra in both cases were left unconsidered.
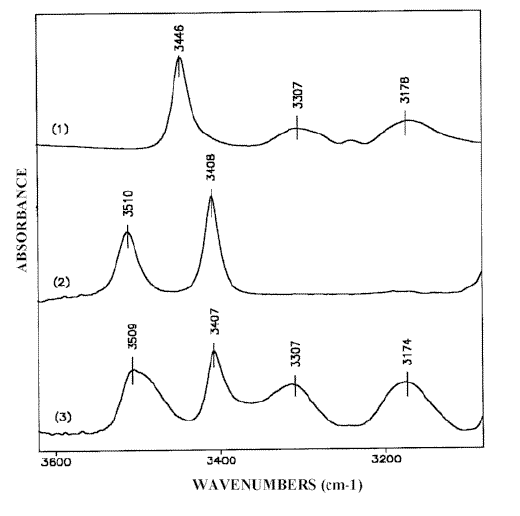
Figure 1. IR-spectra of 2-AP: solid state, Nujol mull (1);solution in carbon tetrachloride, 0.0005 M (2) and 0.5 M (3)
The crystalline structure of 2-AP (Scheme (1)) suggests the following assignment of the NH2 stretching bands in the solid state IR-spectrum (Figure 1.1):
– The absorption maximum at 3446 cm-1 corresponds to the antisymmetric stretch of the dimeric 2-AP (ν asb NH2). Compared with the same vibration of the monomeric 2-AP (ν asf NH2) at 3510 cm-1 (Fig. 1.2), this value is 64 cm-1 low-frequency shifted.
– The bands at 3307 cm-1 and 3178 cm-1 belong to the Fermi-doublet caused by resonance between the symmetric NH2 frequency of the dimeric 2-AP (ν sbNH2) and the overtone of the NH2 bending mode (2δ b NH2). This effect is typical of NH…N hydrogen bond formation involving a primary amino group [14, 16-20]. The symmetric NH2 vibration frequency unperturbed by Fermi-resonance can be calculated using the method described in reference [18]. ν sfNH2 of the monomeric 2-AP is observed at 3408 cm-1 (Figure 1.2), the calculated value of 3235 cm-1 is 172 cm-1 low-frequency shifted. Such a strong shift of the νs NH2 band (Δ ν s NH2) compared to the Δ ν as NH2 is in agreement with only one amino group hydrogen atom being involved in hydrogen bonding [16, 18-22] (Scheme (1)).
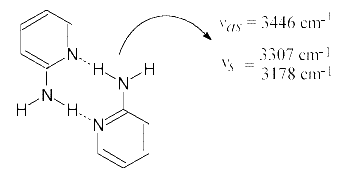
Scheme (1)
The self-association effect is not observed in carbon tetrachloride and chloroform solutions at solute concentrations below 0.001 M. The corresponding spectrum in carbon tetrachloride (Figure 1.2) exhibits only the absorptions discussed above at 3510 cm-1 and 3408 cm-1 of ν asf NH2 and ν sf NH2, in the free species [6, 14, 23]. Increasing the concentration of the solute promotes the NH…N(Py) hydrogen bond formation and leads to a broadening of the low-frequency flank of the NH2 monomeric bands as well as to the appearance of the Fermi-doublet absorption spectrum (Figure 1.3). The clarification of the effects is obtained by curve fitting the IR spectra of solutions in carbon tetrachloride and chloroform with increasing 2-AP concentration. The results suggest an intensity decrease of both monomeric NH2 bands while the Fermi-resonance doublet at 3320-3305 cm-1 and 3180-3170 cm-1 grows simultaneously together the intensities of a new band pair at 3490-3475 cm-1 and 3396-3384 cm-1 (Figure 2). The Δ ν NH2 frequency value (Δ ν NH2 = ν as NH2 – ν s NH2) of these peaks vary within 90-100 cm-1 similarly to the Δ ν NH2 difference of the free species (see Table 1 of [1]). Therefore, the bands discussed should be assigned to ν asnbNH2 and ν snb NH2, respectively, of the non-hydrogen bonded amino group [12]. This result assumes that in carbon tetrachloride and chloroform solutions of 2-AP form chain like (open) dimers and that the band pair at about 3480 cm-1 and 3380 cm-1 corresponds to the NH2 group of the 2-AP molecule associated through the pyridine nitrogen (Scheme (2)). Since the other amino group contains one hydrogen atom involved in hydrogen bonding, the associated ν sbNH2 band should be perturbed by Fermi-resonance and as a result strongly down shifted. The NH2 stretching values near 3240-3230 cm-1, calculated from the Fermi-resonance doublet data on solutions with a range of concentrations [1], is in accordance with this suggestion. The corresponding ν asb NH2 vibration weakly affected occurs around 3465-3445 cm-1 and can only be resolved in spectra with removable concentrations of the dimeric species (see Figure 3) because it strongly overlaps the ν snb NH2 absorption maximum of the non-bonded dimeric NH2 group.
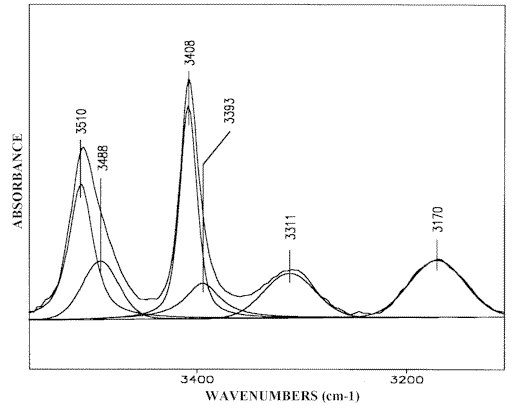
Figure 2. Curve fitting (3550-3100 cm-1) of the 2-AP IR-spectrum, 0.1 M solution in carbon tetrachloride
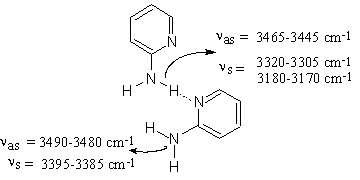
Scheme (2)
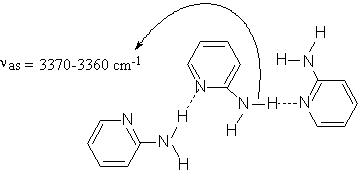
Curve fitting the IR-spectra of the solutions at higher (more than 1M) solute concentration reveals a new band in 3370-3360 cm-1 region (Figure 3) indicating the formation of higher order (mainly trimeric) 2-AP open self-associates (Scheme (3)). These “head-to-tail” structures are typical of 3-aminopyridine (3-AP) in the solid state where 3-AP molecules are chain-linked to each other by (H)NH…N(Py) hydrogen bonds (see Scheme (4)) forming infinite chains parallel to one of the crystallographic axes [24].
The solid state IR-spectrum of 3-AP is shown in Figure 4.1. The Fermi-doublet at 3306 cm-1 and 3158 cm-1 (ν sb NH2) and the band at
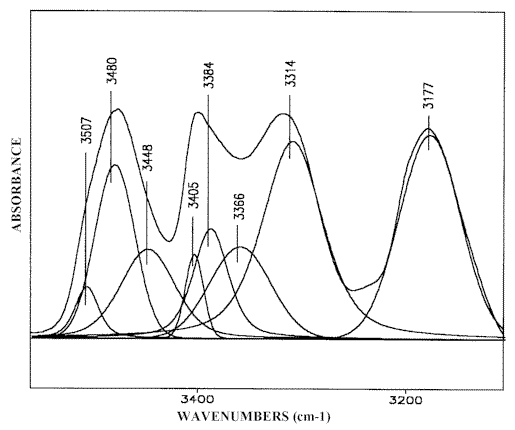
Figure 3. Curve fitting (3550-3100 cm-1) of the 2-AP IR-spectrum,
5 M solution in chloroform
Scheme 3
3377 cm-1 (ν asb NH2) are characteristic of the head-to-tail hydrogen bonded units of 3-AP which are structurally analogous to the central 2-AP isomer molecule in Scheme (3). Melting 3-AP samples breaks the infinite chains and this leads to intensity decreases in the absorption maximum at 3377 cm-1 and a rise in frequency of the Fermi-doublet peaks. Meanwhile, additional bands appear in the 3465-3390 cm-1 region (Figure 4.2), which should be assigned to NH2 modes of the final units of broken 3-AP chains.Scheme (3)
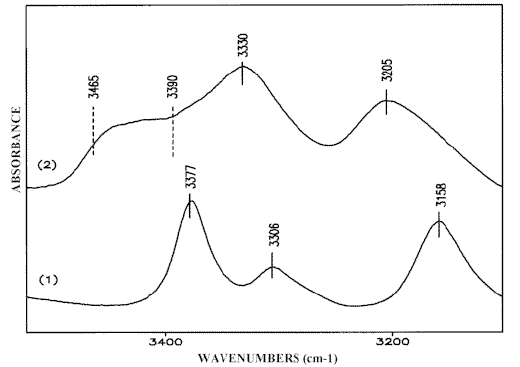
Figure 4. IR-spectra of 3-AP: solid state, Nujol mull (1);
liquid, melt (2);
Curve fitting the IR-spectrum of a 5M 3-AP solution in chloroform deconvolutes the discussed peaks (Figure 5) and the relevant assignment is given in Scheme (4). Curve fitting reveals two supplementary bands at 3486 cm-1 and 3401 cm-1 which can be attributed to the ν asf NH2 and ν sf NH2 vibrations of the monomeric 3-AP, respectively. The data obtained for low concentration solutions of 3-AP chloroform confirm this suggestion [23].
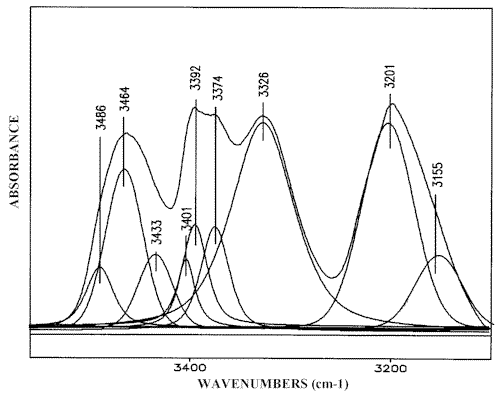
Figure 5. Curve fitting (3550-3100 cm-1) of the 3-AP IR-spectrum,
5 M solution in chloroform
The discussion above substantiates the case that the formation of chain like 2-AP self-associates in non-polar (carbon tetrachloride and chloroform) solutions and in the melt as chains, in a contrast to the solid state where the stabilization of cyclic dimeric structure occurs. The presence of chain like associates in non-polar solvents has been proposed based on luminescence studies of 2-AP [25]. Our conclusions are proved on the basis of the marked similarity between the 2-AP and 3-AP IR-spectra in solution (Figures 3 and 5) and by comparing the spectra of melted 3-AP and 2-AP samples (Figures 4.2 and 6.1). Like 3-AP, the corresponding 2-AP isomer exhibits a spectrum containing absorption maxima at 3465 cm-1 and 3390 cm-1 (Figure 6.1), attributed to the final units in chain-linked self-associates. These bands disappear after crystallizing of the melt where the peak at 3446 cm-1 which is typical of 2-AP cyclic dimers (Scheme (1)) appears (compare Figures 6.2 with 1.1).

Scheme (4)
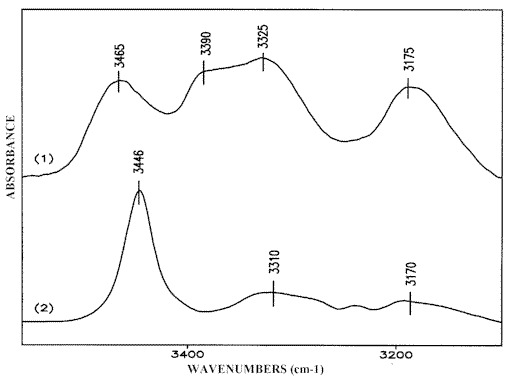
Figure 6. IR-spectra of 2-aminopyridine: liquid, melt (1);
solid state, from melt (2)
IR-linear dichroic (LD) spectral analysis [26]
The study discussed below centres on one of the most powerful tools for the interpretation of IR-spectra and provides effective structural information. The IR-LD-spectral analysis allows us to determine the symmetry characteristic of the IR-bands and as a result facilitates considerably their assignment to vibrational modes. More generally this method can be successfully applied to the investigation of molecular geometry [27]. A productive development of the IR-LD-spectroscopy was realized after the devising of the FTIR-instruments.
The widest-spread version of the IR-LD-spectral analysis is the study of oriented mono- or polycrystalline samples, but the interpretation of the corresponding spectra requires preliminary knowledge about the crystal structure. A partial orientation of isolated molecules can also be achieved by embedding the analyte in polymers (most often polyethylene) and then stretching the blend or by dissolving the analyte in a nematic liquid crystals (NLC). Both the techniques have their advantages and disadvantages. The problems, experimental conditions and particular applications of the former method are discussed in references 27 and 28. The successful applicability of nematic liquid crystals as uniaxial orientation media has also been demonstrated in [29-34]. The anisometric geometry of the nematogenic molecules presents a method of ordering their long axis raising a macroscopic symmetry axis known as the director n (see Scheme (5)). As a rule, NLC substances contain terminal polar groups facilitating solution of a large number of guest compounds, which themselves then show the same orientation as their host nematic mesophases. It has been proved that NLCs of the 4-cyano-4′-alkylbicyclohexhyl type (Scheme (5)) are especially suitable as anisotropic solvents. Their weak and diffuse IR-spectra (Figure 7), (comparable to those of Nujol or polyethylene), make it possible to record the solute bands in the whole 4000 cm-1– 400 cm-1 region. Thanks to the presence of the Cº N group lying on the molecular long axis (Scheme (5)), the polarization of the nitrile stretching IR-band at 2233 cm-1 can be used as an orientation indicator (Figure 7). The orientation of the samples is achieved by rubbing and polishing the IR-cell windows in one direction. Conventional grid polarizers are used to measuring of the IR-LD-spectra.
The IR-LD measurement involves the recording the parallel (IRp) and the perpendicular (IRs) spectra (Figures 7.1 and 7.2) of the oriented sample using the absorption of the pure anisotropic solvent under the same polarization as a reference. The obtained LD values as (Ap-As), where Ap and As are the parallel and perpendicular integrated absorbancies of each band, respectively, divide the bands in the recorded difference spectrum into positive and negative ones (Figure 8). Positive (+) bands originate from transition moments where the average angles of orientation direction lie between 0° and 54.7°(magic angle), whilst negative (-) bands correspond to transition moments directed between 54.7° and 90° (Scheme (5)).
The most effective and precise development of this method is the so called “stepwise reduction” procedure originally introduced for polarized UV-spectra [35] and applied for the first time in [36] to IR-LD spectral analysis of substances embedded and oriented in stretched polyethylene. It consists in subtracting the
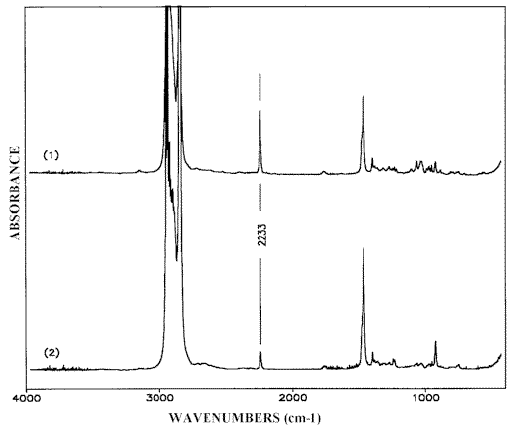
Figure 7. Parallel (1) and perpendicular (2) IR-LD-spectra of liquid crystal mixture LI-1695 (see Scheme (5))
perpendicular spectrum, multiplied by a variable parameter c, from the parallel spectrum (IRp–c.IRs). The parameter c is changed until a band or a set of bands are eliminated from the now reduced difference spectrum. The c value becomes equal to the dichroic ratio R = Ap/As which must be the same for the whole set of bands belonging to a particular symmetry class. If the molecular geometry is known, the consequent elimination of series of bands permits the IR bands to be assigned according to their symmetry properties. The theory and the accomplishment of the method to the IR-spectral study of samples oriented in NLC has been developed in [37, 38]. However, its applicability is restricted to the molecules of C2v and higher symmetry. In more complicated cases e.g., systems of Cs and Ci symmetry, the following simplified utilization of the stepwise reduction method can be useful:
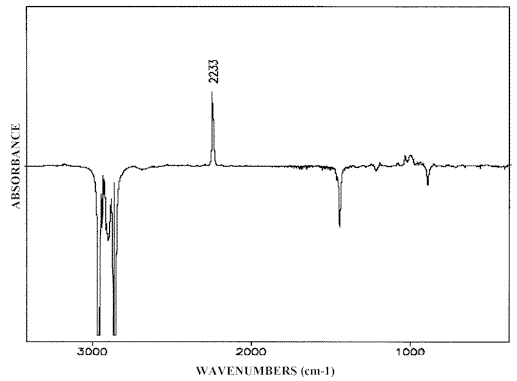
Figure 8. The difference IR-LD-spectrum of ZLI-1695
– The elimination of the absorption maxima in the reduced spectrum makes possible the resolution of strong overlapping bands [39];
– The comparison between the dichroic ratios of definite set of bands enables us to reach conclusions on the mutual orientation of the corresponding bonds or groups. This proposition is reliable only when the transition moment orientations of the modes studied are well-known (see below).

ZLI-1695
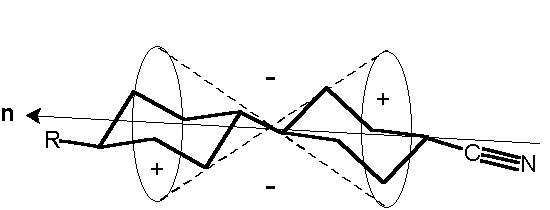
Scheme (5)
An extension of the reduction procedure accomplished to unpolarized IR-spectra was published for the first time in reference 26. The method permits us to identify the IR-bands of components in isomeric systems or in mixtures. Its applicability to the study of the structural transformations in binary glasses has also been demonstrated in reference 40.
A modification of the stepwise reduction to the analysis of unpolarized IR-spectra involves the subtraction of two spectra of substances containing non-equal concentration of a given structural unit (in our case dimeric or monomeric fractions in two 2-AP solutions). Both samples must be measured under the same conditions (only one solvent and cell thickness). The subtraction is performed until a definite band is eliminated in the reduced difference spectrum. The following relationship then applies:
A11 – k(1)A12 = e 1b (c1– k(1)c2) = 0
or (1)
k(1) = ![]() .
.
A11 and A12 from Equation. (1) stand for the absorbances of the manipulated absorption maximum in both spectra characterized by the absorptivity e 1(ν1); c1(2) is the solute concentration of the samples (1) and (2), respectively, b is the path length fixed. The IR-band with a wavenumber ν 1 should correspond to the vibrational frequency of a bond (group) of the analyzed structural unit. k(1)-value is the reducing parameter which corresponds to the elimination of ν 1-band in the difference spectrum.
Relations analogous to Eqn. (1) should be valid for the other absorption the maximum (ν 2), characteristic of the same structural group:
A21 – k(2)A22 = e 2b (c1 – k(2)c2) = 0 (2)
It follows from Equations. (1) and (2) that:
k(1) = k(2) (3),
i.e. the elimination of an IR-band characteristic of a given structural unit of the substance studied should result in the disappearance in the reduced spectrum of all bands belonging to the same unit. The procedure discussed can be visualized using the automatic subtraction routines normally included in most suites of IR-spectra processing programmes. Both spectra are graphically subtracted from each other on the spectrometer screen until the complete elimination occurs for all corresponding IR-bands. The method can also be employed to analyse IR-spectra measured in the solid state where the path length is non-fixed [40].
IR-LD-spectral analysis of the hydrogen bonds in 2-AP solutions is attractive because our results given in section (1) suggest but offer an indirect proof of the formation of chain-like self-associate species. The IR-LD study is complicated by the presence of monomeric 2-AP species in the concentration range, which we have investigated. These create some difficulties in resolving the band around 3490-3480 cm-1 and especially features between 3395-3385 cm-1, both characteristic of the 2-AP open self-associates (see Scheme (2)). These bands overlap strongly with the ν asf NH2 and ν sf NH2 absorption maxima, corresponding to free species. The effect is exaggerated in spectra of solutions containing overwhelming amounts of monomeric 2-AP (see Figure 2). A non-correct curve fitting could be realized in these cases despite an eventual previous deconvolution of the IR-bands.
The IR-LD-spectra of 2-AP were measured using ZLI-1695 (Merck) NLC as an anisotropic solvent (Scheme (5)). The treatment of the data obtained was performed on the assumption that in ZLI-1695 2-AP forms NH…N(Py) self-associates, but not solute-solvent NH…Nº C hydrogen bonds. This assumption is in accordance with the considerably stronger nucleuphilic ability of the pyridine nitrogen. According to the scales describing the hydrogen bond acceptor basicity, the normalized donor number of pyridine is 0.85 vs. 0.36 of acetonitrile [41]. In addition, the corresponding β– and B-parameters are 0.64 vs. 0.31 and 472 vs. 160, respectively [41, 42]. Furthermore, 2-AP possesses higher basicity than pyridine: 6.9 vs. 5.2 (in pKa units) [43].
The difference IR-LD-spectrum of 2-AP illustrated in Figure 9, exhibits the NH2 bands characteristic of both the free and associated species which is in agreement with our results, which are already discussed [1]. The presence of such a monomer-dimer equilibrium requires prior identification of the NH2 bands belonging to monomeric 2-aminopyridine. For this purpose the unpolarized IR-spectrum of saturated 2-AP solution in ZLI-1695 is subtracted from the unpolarized IR-spectrum of 0.5 M solute concentration in the same solvent. The subtraction is performed until the Fermi-doublet at 3317 cm-1 and 3178 cm-1, assigned to the symmetric stretching frequency (ν s b NH2) of the hydrogen bonded NH2 group [1], is eliminated. In accordance with the procedure described above, the remaining bands attributed to the frequencies of the associated amino groups should also disappear. As a result, the reduced IR-spectrum is expected to show only the NH2 absorption maxima of non-associated 2-aminopyridine. A comparison with the IR-spectrum of greatly diluted (0.0005 M) 2-aminopyridine solution in cyclohexanecarbonitrile, regarded as a structural analogue of ZLI-1695 (see Scheme (5)), confirms this assumption (Figure 10).
The difference LD-IR spectrum of 2-AP in the liquid crystalline ZLI-1695 exhibits only positive bands corresponding to the in-plain vibrations of the amino groups (Figure 9), indicating that the dimeric structure (Scheme (2)) is close to a planar configuration. In conjunction with the precondition for linear NH…N(Py) hydrogen bond formation, proved in 2-AP self-association in the solid phase [13], it is suggested that an angle of approximately 600 between both HNH bisectrixes is involved in the structure. The same mutual orientation should be expected for the transition moments of both symmetric NH2 vibrations (Scheme (6)). On the basis of these assumptions, data in the range 1650-1550 cm-1 , obtained by stepwise subtraction of the IRs– from the IRp-spectrum, can be explained as follows:
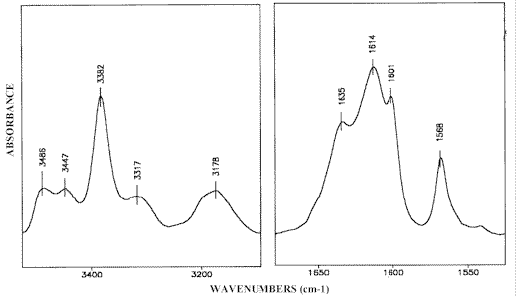
Figure 9. Difference IR-LD- spectrum of 2-AP in ZLI-1695
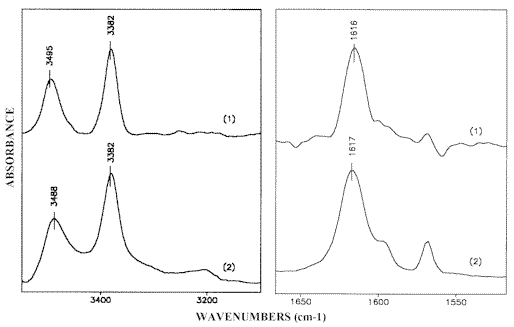
Figure 10.Unpolarized IR-spectra of the monomeric 2-AP species:
in ZLI-1695 obtained by the reduction procedure (1)
and 0.0005 M solution in cyclohexanecarbonitrile (2)
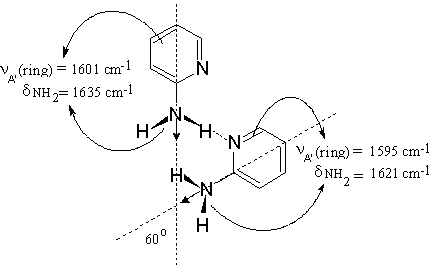
Scheme (6)
– The elimination of the Fermi-resonance absorption maximum corresponding to the ν sb NH2 mode is accompanied by the disappearance of the band at 1635 cm-1 (Figure 11.1). Therefore, the latter should be assigned to the NH2 scissoring frequency of a hydrogen bonded amino group (δ b NH2) because the symmetric NH2 stretch and NH2 scissoring vibration belong to the same symmetry class.
– The peak near 1601 cm-1 assigned to the in-plain pyridine ring vibration (the so-called 8a -mode [44]), is eliminated at approximately the same dichroic ratio that for the band at 1635 cm-1 band (Figure 11.1). The small pyramidal distortion of 15º in the 2 aminopyridine group [13] explains the slight difference in dichroic ratio between the elimination of the then two absorption maxima. These results strongly suggest that 2-AP exhibits an effective Cs molecular shape similar to the aniline [45] further suggesting an insignificant change occurs in the bond parameters when a ring CH group is replaced by a nitrogen atom [46]. Therefore, the bands near 1635 and 1601 cm-1 characterizing 2-AP molecules as species involved in hydrogen bonded amino groups, should be assigned to modes of similar (A¢ ) symmetry class with respect to the plain perpendicular to the ring, a phase directed along the exocyclic CN bond (Scheme (6)).
– Elimination of these two absorption maxima result in the appearance of two residual and clearly separated bands at 1621 cm-1 and 1595 cm-1 (Figure 11.1). The first one, which does not coincide with the δ f NH2 band of monomeric 2-AP at 1616 cm-1 (Figure 11.3, see also Figure 10.1), may well be ascribed to the scissoring vibration of the non-bonded NH2 group (δ nb NH2) in the dimeric structure. The related band at 1595 cm-1 band is assigned to the 8a-ring A¢ –stretch of the same 2-AP molecule hydrogen bonded via the pyridine nitrogen (Scheme (6)). After further reduction the absorption maxima at 1635 cm-1 and 1601 cm-1 appear once again (Figure 11.2).
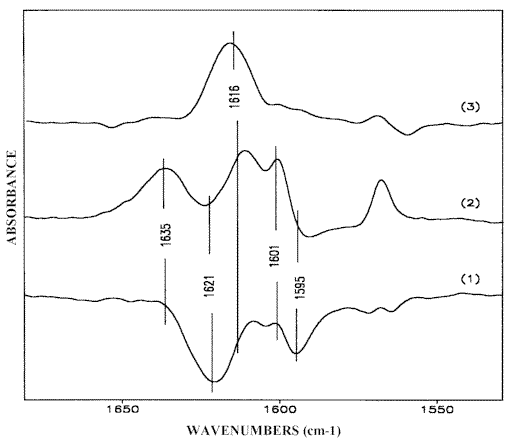
Figure 11. Reduced IR-LD spectra of 2-AP obtained by elimination of the bands at 1635 cm-1 (1) and 1621 cm-1 (2); reduced unpolarized IR-spectrum of the monomeric 2-AP species (3)
Comparison of the results obtained demonstrates a consequent elimination of bands, belonging to any given (δ NH2 and 8a-pyridine ring) modes of similar (A’) symmetry class, thus indicating a cross-related disposition of the interacting solute molecules (Scheme (6)). This is direct evidence for head-to-tail self-associate formation in 2-AP solutions because in the case of the cyclic dimeric structure (Scheme (1)) with parallel orientation of 2-AP molecules [13], the appropriate A’ –bands should be simultaneously eliminated. Verification of this point can be accomplished by means of an IR-LD-study of an oriented polycrystalline 2-AP layer as follows.
The corresponding IR-LD spectra are given in Figures 12 and 13. The absence of the Fermi-resonance and d NH2 peaks in the parallel spectrum (Figure 12.1) demonstrates the colinearity of the transition moments of both of the NH2 symmetric vibrations in the parallel oriented dimers (Scheme (1)). In the region 1650-1550 cm-1 the perpendicular spectrum (Figure 12.2) and the difference spectrum (Figure 13.1) both exhibit two bands at 1630 cm-1 and 1598 cm-1 belonging to the NH2 scissoring and 8a–pyridine ring modes respectively. Both bands are missing in the parallel spectrum (Figure 12.1). The bands also disappear in the reduced LD-spectrum after elimination of the Fermi-resonance maxima a reduction that does not produce the appearance of any additional peaks characteristic of the cyclic dimeric structure (Figure 13.2). The residual low-intense absorption maximum at 1635 cm-1 can be explained by the presence of a small amount of chain-like self-associates stabilized during melt cooling. Such a band is typical of the 2-AP spectra in solution (see above) and it always appears as an additional peak in the solid state spectra of samples crystallized from 2-AP liquid layers.Comparison of the results obtained demonstrates a consequent elimination of bands, belonging to any given (d NH2 and 8a-pyridine ring) modes of similar (A’) symmetry class, thus indicating a cross-related disposition of the interacting solute molecules (Scheme (6)). This is direct evidence for head-to-tail self-associate formation in 2-AP solutions because in the case of the cyclic dimeric structure (Scheme (1)) with parallel orientation of 2-AP molecules [13], the appropriate A’ –bands should be simultaneously eliminated. Verification of this point can be accomplished by means of an IR-LD-study of an oriented polycrystalline 2-AP layer as follows.
Comparison between the IR-LD-spectra of 2-AP oriented in an NLC solvent and that of a capillary sample confirms the results described above an the comparative IR-spectral analysis the various disparate type of 2-AP self-association both in solution and in the solid state.
These complementary studies illustrate very distinctly the potential lying in the use of these IR methods effects and their application to the structural characterization of complex organic systems where hydrogen bonded associates, coordination compounds or polymer compounds are involved.
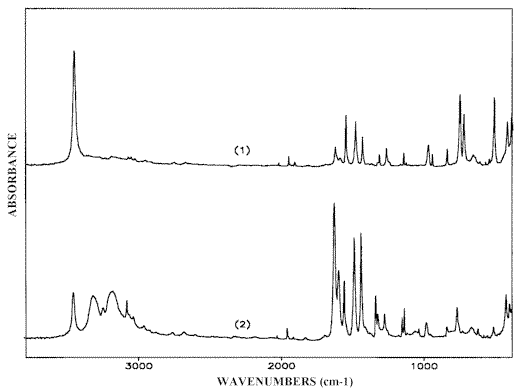
Figure 12. Parallel (1) and perpendicular (2) IR-LD-spectra of solid state 2-AP crystallized from melt
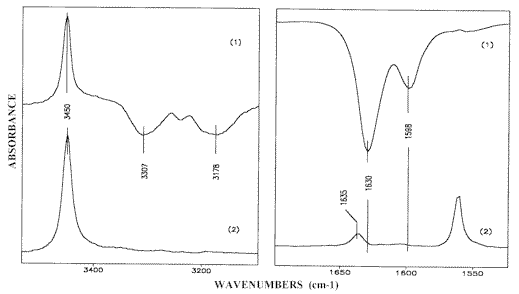
Figure 13. Difference (1) and reduced (2) IR-LD spectra of solid state 2-AP
References
- Received 16th August 2001, received in revised format 23rd November ,
Arnaudov, M.; Dinkov, Sh. Spectrosc. Lett., 1998, 31, 1687. - Berezin, V.; Elkin, M. Optika i spektrosk. (Russ. edn.), 1974, 36, 905.
- Bü yü kmurat, Y.; Akalin, E., Ö zel, A. E., Akyü z, S. J. Mol. Struct., 1999, 482, 579.
- Angyal, C.L.; Werner R.L. J. Chem. Soc., 1952, 2911.
- Spinner, E. J. Chem. Soc., 1962, 3119.
- Goulden, J.D.S. J. Chem. Soc., 1952, 2939.
- Katritzky, A.R.; Hands, A.R. J. Chem. Soc., 1958, 2202.
- Mason, S.F. J. Chem. Soc., 1958, 3619.
- Thompson, W.K. J. Chem. Soc., 1962, 617.
- Yagudaev, M.R. ; Schejnker, Yu.N. Dokl. Akad. Nauk SSSR, ser. Fiz. Khim. (Russ. edn.), 1962, 144, 177.
- Yagudaev, M.R.; Popov, E.M.; Yakovlev, I.P.; Schejnker, Yu.N. Izv. Akad. Nauk SSSR, ser. Khim.(Russ. edn.), 1664, 7, 1189.
- Bellamy, L.J.; Pace, R. Spectrochim. Acta, 1972, 28A, 1869.
- Chao, M.; Schempp, E.; Rosenstein, R.D. Acta Cryst., 1975, B31, 2922.
- Sugeta, H. Bull. Chem. Soc. Jpn., 1981, 54, 3706.
- Inuzuka, K.; Fujimoto, A. Spectrochim. Acta., 1984, 40, 623.
- Wolff, H.; Staschewski, D. Z. Electrochem., Ber. Bunsenges. Phys. Chem., 1962, 66, 140.
- Wolff, H.; Eints, J. Ber. Bunsenges. Phys. Chem. 1966, 70, 728.
- Wolff, H.; Horn, D. Ber. Bunsenges. Phys Chem., 1968, 72, 419.
- Wolff, H.; Horn, D. Ber. Bunsenges. Phys. Chem, 1967, 71, 467.
- Wolff, H.; Mathias, D. J. Phys. Chem., 1973, 77, 2081.
- Lauransan, J.; Pineau, P.; Josien, M.-L. Ann. Chim., 1964, 9, 213.
- Lauransan, J.; Corset, J.; Forel, M.-T. Ann. Chim., 1968, 3, 109.
- Ramiah, K.V.; Puranik, P.G. J. Mol. Spectrosc., 1961, 7, 89.
- Chao, M.; Schempp, E.; Rosenstein, R.D. Acta Cryst., 1975, B31, 2924.
- Waluk, J. J. Mol. Struct., 1988, 177, 415.
- Arnaudov, M.; Dinkov, Sh. J. Mol. Struct., 1999, 476, 235.
- Michl, J.; Thulstrup, E.W. Spectroscopy with Polarized Light, VCH: New York, 1986.
- Thulstrup, E.W.; Michl, J. Elementery Polarization Spectroscopy, VCH: New York, 1989.
- Belhakem, M.; Jordanov, B. J. Mol. Struct., 1990, 218, 309.
- Belhakem, M.; Jordanov, B. J. Mol. Struct., 1991, 245, 29.
- Belhakem, M.; Jordanov, B. J. Mol. Struct., 1991, 245, 195.
- Belhakem, M.; Jordanov, B. J. Mol. Liq., 1992, 53, 161.
- Rogojerov, M.I.; Arnaudov, M.G. J. Mol. Struct., 1994, 321, 147.
- Rogojerov, M.I.; Arnaudov, M.G. J. Mol. Struct., 1994, 321, 157.
- Thulstrup, E.W.; Eggers, J.H. Chem. Phys. Lett., 1968, 1, 690.
- Spanget-Larsen, J. SPIE, 1992, 1575, 404.
- Jordanov, B.; Nentchovska R.; Schrader, B. J. Mol. Struct., 1993, 297, 401.
- Jordanov, B.; Schrader, B. J. Mol. Struct., 1995, 347, 389.
- Jordanov, B.; Rogojerov, M.; Schrader, B. J. Mol. Struct., 1997, 408/409, 309.
- Arnaudov, M.; Dimitriev ,Y. Phys. Chem. Glas., 2001, 42, 99.
- Reichardt, Chr. In Solvents and solvent effects in organic chemistry (2nd ed); VCH: Weinheim, Basel, Cambridge, New York, 1990; pp. 21, 378.
- Koppel, I.A.; Paju, A.I. Reakt. sposobn. org. soedin. (Engl. edn.), 1974, 11, 121.
- Katritzky, A.R.; Rees, C.W. In Comprehensive heterocyclic chemistry; A.R. Katritzky, Ed.; Pergamon Press: New York, Toronto, Sydney, Paris, 1984, Vol. 2, pp. 170, 171.
- Varsznyi, G., In Vibrational Spectra of Benzene Derivatives, Akademiai Kiado: Budapest, 1969, p. 71.
- Radziszewski, J.G.; J. Michl, J. Am. Chem. Soc., 1986, 108, 3289.
- Katritzky, A.R.; Ambler, A.P. In Physical Methods in Heterocyclic Chemistry; A.R. Katritzky, Ed.; Academic Press: New York; London, 1963; Vol. 2, pp. 285-289.
Received 16th August 2001, received in revised format 23rd November ,accepted 26th November 2001.
REF: Michail G Arnaudov Int. J. Vib. Spect., [www.irdg.org/ijvs] 5, 5, 5 (2001)

