The Basic Physics of Infrared Emission Spectroscopy
William Maddams
University of Southampton
Until recently Chief Vibrational Spectroscopist, BP Research, Sunbury on Thames, UK.
The analytical potential of infrared emission spectroscopy as a characterisational technique rests upon the fundamental fact that if a body emits radiation of one or more wavelengths under given conditions it will also absorb those wavelengths under the same conditions. This tenet requires justification; fortunately, the required reasoning is quite simple.
Consider a body in equilibrium with its surroundings in a uniform temperature enclosure, exchanging energy only by radiation. Under these conditions it must absorb exactly the same energy, in any time interval, as it emits, otherwise its temperature will rise or fall. Furthermore, it must absorb exactly the same wavelength as it emits, otherwise the character of the radiation within the enclosure would alter with time, and would depend on the contents of the enclosure and not simply on its temperature. More generally, it may be shown that in non-equilibrium conditions, which often occur in practice, the absorptions and emission processes, at one or more wavelengths will still occur, but not necessarily at the same temperature.
Bunsen and Kirchhoff, some one hundred and fifty years ago, devised an elegant but simple experiment that demonstrates the correctness of what was deduced above by simple reasoning. Their equipment is shown schematically in Figure 1.
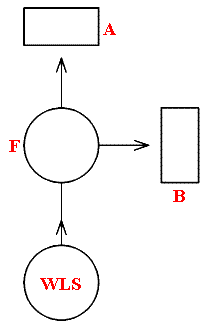
Figure 1.
F is a sodium flame, such as is obtained by feeding sodium chloride into a Bunsen burner. When this is viewed through the prism spectroscopes A and B the well known bright yellow doublet, with lines and 5890 and 5896 angstroms, is seen. When the strong white light source [WLS], shining through the flame and in line with A, is switched on, a continuous spectrum with two dark lines at 5890 and 5896Aº is observed through A. However, spectrometer B, at right angles to the line of WLS/F/A, still shows that yellow sodium doublet.
The explanation is that the flame has absorbed the wavelengths 5890 and 5896Aº from the white light source and re-radiated it in all directions, and the amount falling on the entrance slit of spectrometer A is so small that two dark lines appear against the otherwise continuous background. This, incidentally is the cause of the various Fraunhofer lines, characteristic for a number of elements, that appear in the solar spectrum. When the flame, with the white light illumination passing through it in the direction WLS/F/A, is viewed at right angles via spectrometer B., the two sodium yellow lines are still present at unchanged intensity.
One clear consequence of the relation between emission and absorption is that a wholly transparent medium cannot emit. This may appear contrary to everyday experience, but it has been demonstrated by Professor R.W. Wood, who devised many beautiful and clever experiments in physical optics. He used a rod of very pure fused quartz, free from small particles of foreign matter. When this was heated in a Bunsen flame there was only a very small amount of light emission. However, when it was heated to a higher temperature in an oxy-coal gas flame it became vividly incandescent. The bluish luminosity faded when the rod was removed from the flame but, on cooling, it did not pass through the usual stages of yellow and red heat. The explanation for the bluish luminosity is that, at ambient temperatures, quartz has an absorption band well into the ultraviolet spectral regions. This moves to longer wavelengths with increasing temperature and, with an oxy-coal gas flame reaches the violet end of the visible spectrum. Hence, as there is absorption, emission is also possible. The absorption moves back into the ultraviolet region as the sample cools, so it cannot pass through the yellow and red heat stages.
Any absorption spectrum displays the peaks in terms of loss of intensity from the incident intensity, which is set at 100%, so the spectrum has percentage transmission as its intensity scale. The emission spectrum represents an increase in intensity from a baseline of zero intensity. It follows that the emission spectrum will be the mirror image of the absorption spectrum as is shown in Figure 2, where the intensity of emission scale has been adjusted, in arbitrary units so that the peak heights in the two spectra are equal.
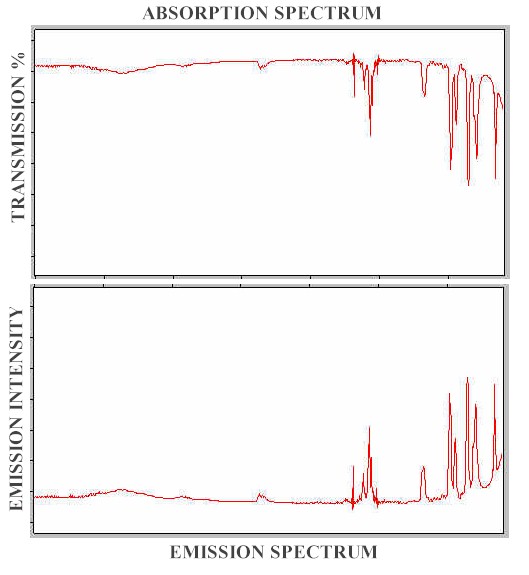
Figure 2. Infrared absorption and emission spectra
.The difference between the two spectra is that the absorption intensity has been measured in terms of a ratio whereas the emission intensity is a straight measurement and will depend upon several factors, most notably the temperature of the emitting body. It is therefore highly desirable that the emission intensity should also be expressed as a suitable ratio. A convenient way for doing this emerges when the emission process is considered in terms of some simple mathematics. The first step is to quantify the term emission. A convenient unit is the total energy emitted per square centimetre per second, for a particular temperature. This is termed THE TOTAL EMISSIVE POWER, denoted by the symbol ε.
Consider, once again, a body at equilibrium in a constant temperature enclosure. The energy emitted per square centimetre per second in all directions between wavelength λ and λ+d λ, at a given temperature, is ε λd λ, where e is the emissive power of the surface for that particular wavelength and temperature
Let the energy falling on unit area per second within the same wavelength limits be dQ. This depends only on the temperature of the enclosure. Also, let the fraction of the incident energy absorbed between the wavelengths λ and λ+d λ, be aλ, an entity usually termed the ABSORPTIVE POWER of the surface. Hence, the total energy absorbed by the unit area per second is aλdQ.
As the temperature of the body is constant, the rate of emission of energy must equal the rate of absorption. Thus, ε λd λ = aλdQ or
ε λ/a λ= dQ/Aλ
Since d λ is a chosen, fixed interval and dQ depends only on the temperature of the enclosure, the right hand side of the equation must be constant so
ε λ/a λ= constant
This equation is generally applicable and, in particular, to a black body, which is defined as a perfectly absorbing, perfectly emitting body. If, for this black body, the emissive and absorptive powers are denoted by Eλ and Aλ respectively, then
ε λ/a λ= Eλ/ Aλ
Then, because absorptive power is defined as a fractional quantity, Aλ = 1, giving
ε λ/a λ= Eλ
Hence, at any given temperature, the ratio of the emissive power of any body to its absorbing power for that wavelength at that temperature is constant, and is equal to the emissive power of a black body at that temperature. This is Kirchhoff’s Law, and provides the basis for infrared emission spectroscopy. Since El is a clearly defined entity, it is convenient for practical purposes to express the results of experimental measurements as the ratio ε λ/Eλ. This is known as the EMITTANCE, and spectra are a plot of emittance as a function of wavelength. It is useful to note, at this juncture that, for experimental purposes, a roughened surface coated with soot provides a good approximation to a black body.
As noted above, emissive power is temperature dependent, increasing with increasing temperature. However, emittance is independent of temperature, because el and El are always measured at the same temperature. If a black body at temperature T is surrounded by a perfectly black surface at temperature To, the latter being greater than T, the gain of energy of the black body is given by the equation E = s (To4 – T4 ).
This is Stefan’s Law, which he deduced experimentally, and it was later given a theoretical proof by Boltzmann, on thermodynamic grounds.
The practical implications of this equation are that the emission from a body at a higher temperature than its surrounding increases rapidly as the temperature difference between them increases. This is important because the emitted energy level is relatively small but, on the other hand, the chemical stability of the sample being heated may determine the maximum temperature to which it may be heated to obtain an infrared emission spectrum. Additionally, it is evident that if the sample is at ambient temperature, but the radiation detector is cooled it may be possible to measure a spectrum, a fact which has practical implications.
A black body, by definition, can only absorb and emit. With real life samples some energy transfer by reflection will always occur. The degree of specular reflection as the emitted radiation leaves the sample, is a function of the refractive index of the sample, and at normal incidence and a refractive index of 1.5, which is typical for many organic compounds, it amounts to about 4%. This is not significant but its effect is evident, as a secondary effect, in distorting the shapes of stronger emission peaks. This is because the refractive index of the sample changes in the vicinity of these peaks, falling on the high frequency side of the maximum and rising on the low frequency side, to as much as 2.5. The consequential effect is a small reduction in the reflectance on the high frequency edge of the peak and a rather larger increase on the low frequency side. This, in turn, produced a degree of distortion in the emission spectrum, but the effect is unlikely to be large enough to lead to a misinterpretation of the measured emission spectrum.
To conclude, a few brief comments on the measurement of infrared emission spectra will complement and supplement the background information given above. The T4 dependence of the emission intensity shows that a doubling of the difference in the sample and detector temperatures should lead to a sixteen-fold increase in intensity. In practice, the maximum usable temperature may well be determined by the sample stability. Fortunately, the sensitivity of modern Fourier Transform spectrometers is such that emission intensity is seldom the limiting factor. Furthermore, instruments with cooled detectors are available, so that it may be possible to operate with the omitting sample at ambient temperature, given that the spectrometer design is such that radiation emitted by surfaces in the instrument itself does not reach the detector.
The usual practice is to remove the normal spectrometer radiation source and replace it by the heated sample. This can take a number of forms. Solid films are conveniently dealt with mounted inside a heated liquid cell, whose transparent windows have a loe emissivity. Alternatively, a solid sample may be placed in contact with a polished metal surface and this is effective given that the sample is not too thick and there is a significant temperature gradient from the back to the front of the film. Such samples may occur in practice, in the form of thin polymer films on aluminium cans. When the emission spectrum of the sample has been recorded and stored in the computer memory, the sample is replaced by a black body at the same temperature. Its emission spectrum is measured and the ratio of the emission curves of the sample and the black body gives the required emission spectrum in units of emittance.
REF: W. Maddams. Int. J. Vib. Spect., [www.irdg.org/ijvs] 5, 2, 2 (2001)