Computer Modelling of properties of alcohols

1W. O. George, 2B. F. Jones, 1Rh. Lewis and 1J. M. Price
1School of Applied Sciences,
2School of Computing
University of Glamorgan,
Pontypridd, CF37 1DL, UK
Abstract
Vibrational spectra of proton donor compounds have long provided evidence for hydrogen bonding and the infrared spectra of alcohols were interpreted in the 1930’s in terms of molecular species associated by hydrogen bonding. The nature of these species in terms of number of alcohol molecules and structure of resulting complex has been the subject of much controversy up to the present day and evidence for hydrogen bonding structures is reviewed for methanol, ethanol and higher alcohols. Models of structures computed byab initiomethods provide a theoretical framework for revisiting the experimental work and predicting species hitherto unconsidered, including forms of cyclic trimer and tetramer which are chiral. The average difference between experimental and calculated values of methanol modes for ten basis sets within each of Hartree Fock (HF), Moller Plesset (MP2) and Density Functional Theory (B3LYP) methods is compared and found to decrease with increasing number of basis functions and with increased electron correlation.
Introduction
Methanol and ethanol are manufactured in large quantities for a variety of industrial uses and are members of a series of alkanol compounds (commonly – alcohols). These display affinities with hydrophobic and hydrophilic phases according to the number and position of the hydroxy group in relation to the alkyl chain which may be linear, branched or substituted by aromatic or other groups. Whereas methanol and higher alcohols are toxic, ethanol, as a fermentation product of carbohydrate based plant materials, has a long history of adaptation in human consumption with characteristic effects on those who drink significant quantities of alcoholic beverages!
Water, methanol and ethanol are successive members of the series H-(CH2)n-OH. Characteristic signals in the millimetre wave region are prominent in the constellation of Orion [1] (seen as the dagger carrying hunter to early observers) and are assigned to the rotational spectrum of methanol, which together with ethanol is detected elsewhere in space [2] with significant abundance although small compared with that of water. Simple alcohols are amongst the fundamental molecular species forming the building blocks of organic life on planet Earth and, conceivably, elsewhere within the vast domains of space and time in the Universe.
The chemical and biological properties of alcohols and other O-H containing compounds, are determined by the effect of the group on surrounding substrates and it has long been recognised that alcohols can hydrogen bond intermolecularly to other O-H groups in other molecules, with either the same or different structure, or intramolecularly within one molecule. Hydrogen bonding in alcohols leads to dramatic changes in the vibrational frequencies associated with the O-H group and the infrared region (more so than in the Raman spectrum) displays a large increase in intensity and band-width for the hydrogen bonded O-H stretching mode when shifted to lower wavenumber values.
These effects are illustrated by spectra of methanol (Figure 1) and ethanol (Figure 2) recorded by ourselves [3,4] and used to estimate approximate integrated absorption coefficients and hence approximate concentrations together with those of a fourth component from band deconvolution. There are long standing controversies on the assignment of these bands which occur to varying extents in all alcohols and will be briefly summarised including some very recent work which conveys that the conflicts are far from settled.
For convenience the principal bands are labelled {A}, {B} and {C}. The assignments for any alcohol are considered within the equilibria shown in Table 1.
| monomer = | dimer = | trimer = | tetramer = | higher polymer |
| ROH | (ROH)2 | (ROH)3 | (ROH)4 | (ROH)n |
| open chain | open chain | open chain | open chain | |
| closed ring | closed ring | closed ring | closed ring |
Table 1.Possible components for hydrogen bonded equilibria of alcohols
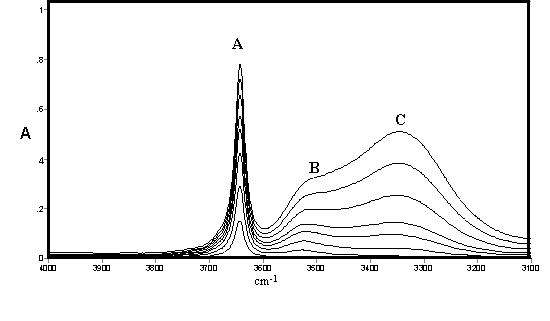
Figure 1. IR spectra of methanol in CCl4 solution [0.10 – 0.80% (v/v)]
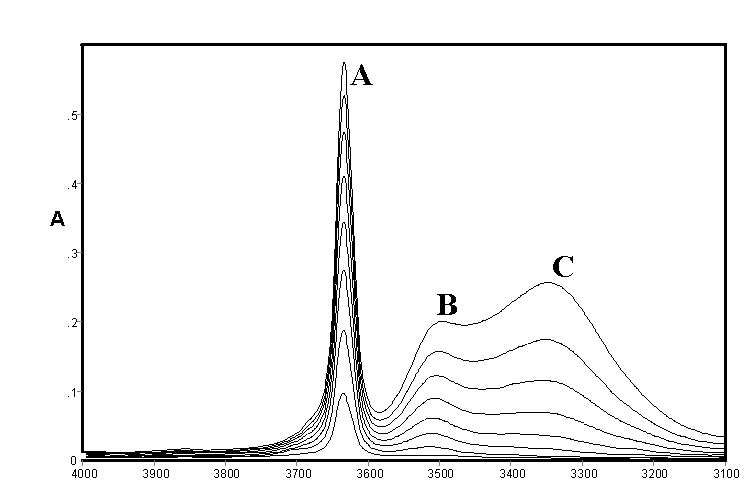
Figure 2.IR spectra of ethanol in CCl4 solution [0.10 – 0.80% (v/v)]
It may be noted that the open chain and closed ring (or cyclic) forms may each have several conformations and symmetries leading to a large number of possible structures in rapid equilibrium. The existence of hydrogen bonding in alcohols was the subject of early classical studies by Errera and Mollet [5] and by Fox and Martin [6] The assignment of the hydrogen bonded shifted O-H stretching vibration in CCl4 solutions of methanol, ethanol, and t-butanol was the subject of a detailed study by Liddel and Becker [7] on the basis of variable temperature intensity studies and derived enthalpy values. They assigned the monomer to a sharp band (3645-3615 cm-1 – band A) the dimer to a medium width-band (3525-3490 cm-1 – band B) and a polymer to a broad band (3330-3250 cm-1 – band C). They concluded that the dimer is cyclic but did not comment on the likely structure of the band assigned to polymer. Alternative assignments to bands B and C are discussed by by ourselves for methanol, ethanol and higher alcohols [3,4]
The consensus of this earlier work supports the assignment of Band {A} to monomer, Band {B} to an open chain dimer and Band{C} to a cyclic trimer in methanol, ethanol and higher alcohols in which these bands are also present. The assignments of other species summarised in Table 1 is less clear but studies by ourselves [3,4] led to tentative assignments of the cyclic tetramer as a component of the broad band shown as {C}. which was also deemed to possibly include various open chain forms listed in Table 1. A substantial range of work using a variety of techniques supported the existence of a cyclic tetrameric form of methanol (and presumably ethanol and other alcohols) but the assignment of bands to this species in the infrared would appear speculative. However a very recent paper by Kristiansson [8] measured the infrared spectra of CH3OH and CD3OH in solution in CCl4 and assigned a band at 2960 cm-1 in CH3OH and 2790 cm-1 in CD3OH to the cyclic tetramer. These would correspond to shifts due to hydrogen bonding of 684 and 854 cm-1 respectively which is considerably larger than normally found in alcohols
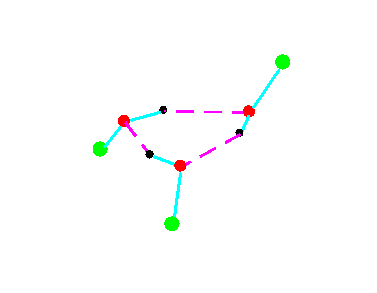
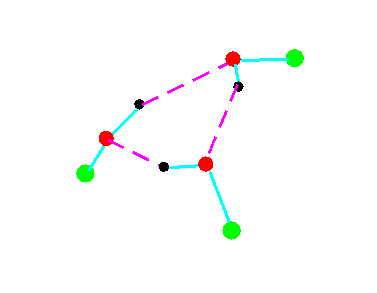
Turning to the structures and symmetries of these forms the cyclic trimer may exist with C1 or C3 symmetry and the cyclic tetramer may exist with C1, C4, Cior S4 symmetry in terms of the ring structure excluding consideration of the alkyl conformations. Structures calculated by ab initio methods [3,4] of the open chain and cyclic forms are shown in Fig 3 and Fig 4 respectively and corresponding hydrogen bonded shifted wavenumber values and hydrogen bonded energies are included in Table 2 and Table 3. Whereas it has been possible to determine properties of two cyclic forms of the cyclic trimer of both methanol and ethanol using several intermediate level basis sets it has only been possible so far to calculate properties of the cyclic tetramer with S4 symmetry for methanol at the HF/6-31G(d) and HF/6-31++G(d,p) levels and ethanol at the HF/6-31G(d) level. On steric grounds the S4 form would be expected to be the most stable but this does not preclude the existence of forms belonging to the other three point groups.
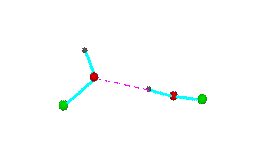
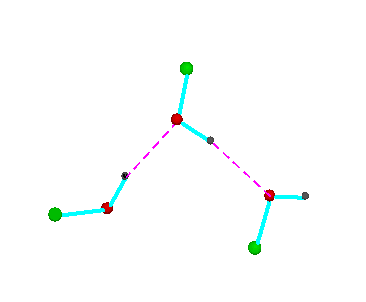
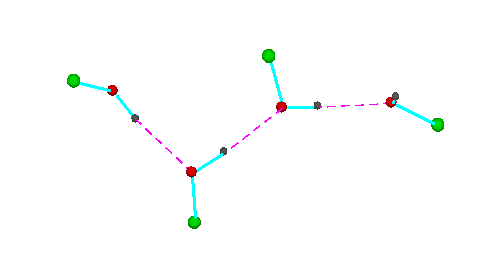
Figure 3.Open chain forms of alcohols (methanol, green = CH3,; ethanol, green = C2H5
 C1
C1
C3
Figure 4a.Cyclic trimeric forms of alcohols (methanol, green = CH3,; ethanol, green = C2H5)
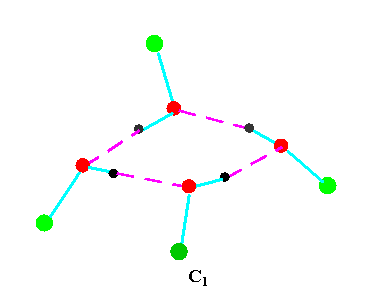
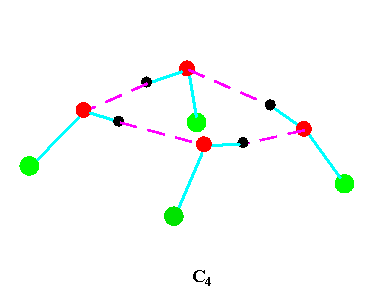

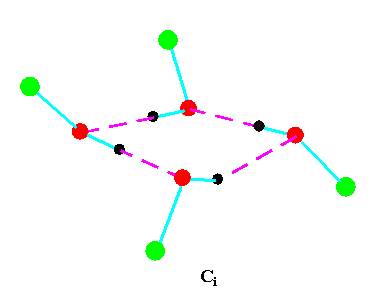
Figure 4b.Cyclic tetrameric forms of alcohols
(methanol, green = CH3,; ethanol, green = C2H5 )
| (ROH)n | basis set | ν1 | ν2 | ν3 | ν4 | EH-Bond |
| n=2, R=CH3 | HF/6-31++G(d,p) | -3 | -69 | -20.8 | ||
| n=2, R=C2H5 | HF/6-31++G(d,p) | -2 | -61 | -21.6 | ||
| n=3, R=CH3 | HF/6-31++G(d,p) | +1 | -102 | -124 | -48.7 | |
| n=4, R=CH3 | HF/6-31++G(d,p) | -4 | -91 | -114 | -156 | -73.5 |
Table 2. Calculated shifts (cm-1) in hydrogen bonded O-H stretching modes and hydrogen bonded energies (kJ mol-1) for open chain alcohols
| (ROH)n | Point group | Basis set | ν1 | ν2 | ν3 | ν4 | EH-Bond |
| sym species | a | a | a | ||||
| n=3, R=CH3 | C1 | HF/6-31G(d,p) | -116 | -119 | -155 | -69.0 | |
| n=3, R=C2H5 | C1 | HF/6-31G(d,p) | -113 | -116 | -151 | -68.7 | |
| sym species | e | e | a | ||||
| n=3, R=CH3 | C3 | HF/6-31G(d,p) | -112 | -112 | -146 | -65.9 | |
| n=3, R=C2H5 | C3 | HF/6-31G(d,p) | -110 | -110 | -142 | -65.7 | |
| sym. species | b | e | e | a | |||
| n=4, R=CH3 | S4 | HF/6-31G(d) | -141 | -162 | -162 | -207 | -118.9 |
| n=4, R=C2H5 | S4 | HF/6-31G(d) | -136 | -156 | -156 | -197 | -118.9 |
Table 3. Calculated shifts (cm-1) in hydrogen bonded O-H stretching modes and hydrogen bonded energies (kJ mol-1) for closed ring (cyclic) alcohols
The experimental and theoretical evidence for the hydrogen bonded forms of methanol and ethanol indicates there is still uncertainty for the structures and assignments of some of these forms. The present paper identifies some predicted structures and properties which may be clarified by further work.
Experimental and Computational Results
Ethanol and carbon tetrachloride were BDH SpectrosoL reagents. IR spectra were recorded on a Perkin Elmer Spectrum 2000 FTIR at 298 K at 1 mm pathlength under conditions described previously [3]. Curve resolution of overlapping bands was undertaken using the Galactic Grams/386 computer package [9]. Ab initio calculations using the Hartree Fock method were carried out using the Gaussian 94w package [10] operating on a Viglen PC Pentium 2 (266 MHz, 64 MB RAM, 3GB disk space). Calculations by Gaussian methods using the Moller Plesset (MP2) and the Density Functional Theory (B3LYP) methods were frequently too large for the PC and were carried out by remote access to the Columbus and Magellan facilities at the Rutherford Appleton Laboratory using the DEC 8400 supercomputer.
Calculations by methods pioneered by Pople et al. [10] are well established for optimised structure, spectroscopic and thermodynamic properties from first principles (ab initio) from the time-independent form of the Schrodinger Wave equation
Hψ = Eψ
H is the Hamiltonian operator, ψ is the wavefunction and E is the energy of the particles comprising a model of the system. The inputs to the calculation are the co-ordinates of the model, the masses of the particles and the value of the Planck constant. The wave functions, ψ, are related to the molecular orbitals of the electrons in the model which are expressed as a linear combination of a pre-defined set of one-electron functions known as the basis sets which are available at successive levels of approximation.
A calculation usually requires a compromise between the choice of high level basis sets requiring considerable CPU power and low level basis sets requiring modest CPU power. The level of basis set, CPU power and speed may be traded one against the other (rather like resolution, signal to noise ratio and recording time when measuring spectra) and criteria which assess the value of the output are necessary to make informed choices. Computational and experimental trading rules are used in tandem to gain maximum information.
Calculations by all three methods were carried out using ten basis sets and the properties for methanol determined. The stable model was taken as that in which the methyl hydrogen atoms are staggered with respect to the O-H group. This corresponds to the planar Cs point group and the 12 vibrations split into 9 a' and 3a' vibrations. Selected geometrical, spectroscopic, thermodynamic results and the dipole moments for the Hartree Fock method are summarised in Table 4 for ten basis sets. The C1 and C3 cyclic trimeric forms and the C1 and C4 tetromer forms are shown in Figure 4 to have chiral structures which would be short-lived with rapid interconversion between the various hydrogen bonded structures.

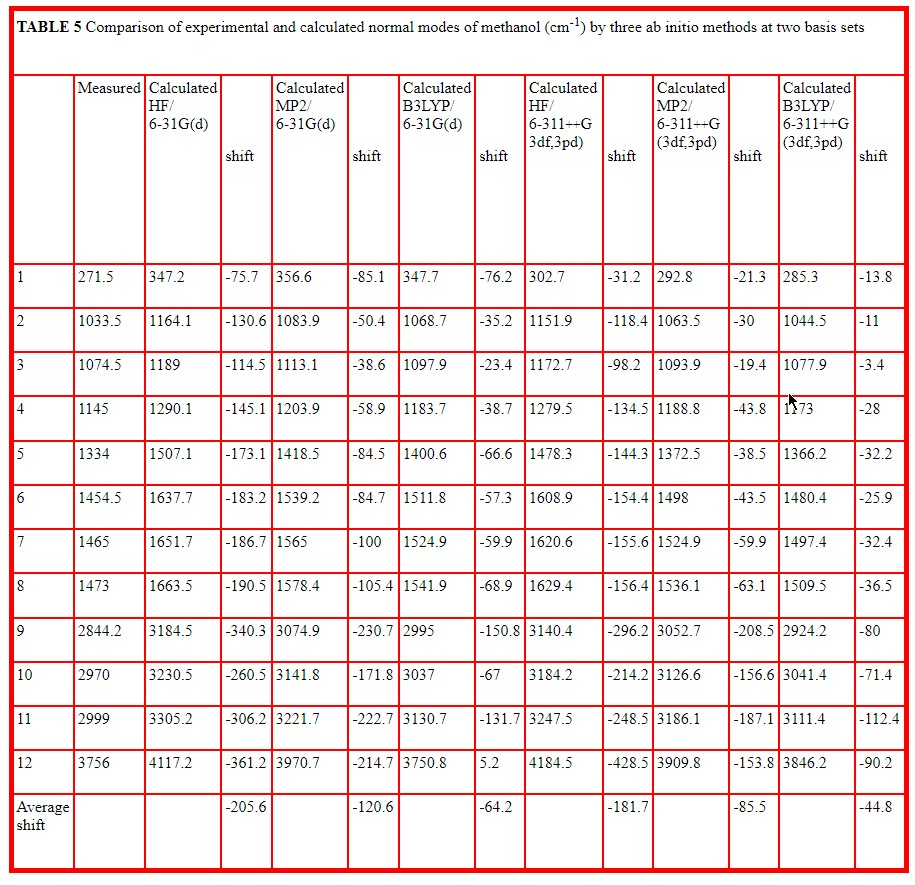
The basis sets correspond to different levels of approximation for molecular orbitals and higher basis sets are composed of greater numbers of basis functions. The number of basis functions for each basis set is included in Table 4. This Table selects the O-H and C-O stretching vibrations which are the most characteristic of alcohols and reports the calculated wavenumber value together with the calculated IR and Raman intensities in arbitrary units for all ten basis sets at the Hartree Fock level. Table 5 reports all twelve normal vibrations of methanol for the smallest and largest basis sets used for the three methods, HF, MP2 and B3LYP. Here the calculated wavenumber values are compared with the measured values reported by Serrallach, Meyer and Gunthard [11].
The co-ordinates of the output model from any Gaussian calculation are readily transferred into a standard pdb (protein database) file which may then be exported to a package such as ChemX [12] and the model displayed as in Figure 3 and Figure 4 above. In the present calculations the model was optimised using the 6-31G(d) basis set and the output used as the initial model for the other nine basis sets.
Discussion
As shown in Figure 1 and Figure 2 the IR spectra of methanol and ethanol are generally similar in the O-H stretching region In each case a fourth feature within the broad feature centred near 3300 cm-1 (band {C}) had been identified at 3438 cm-1 and 3210 cm-1 respectively and curve resolution used to estimate integrated absorbance values and determine approximate amounts of hydrogen bonded species. The best fit was obtained using a combined Gaussian-Lorentzian linear function at an initial band half-width of 45 cm-1. These bands were tentatively assigned to a tetramer and/or another trimer. Smaller initial half-band widths suggested increasing numbers of component bands and the possibility cannot be ruled out that there are a number of hydrogen bonded forms with closely overlapping bands in all alcohol spectra under these conditions in this region. In the absence of detailed experimental or theoretical supporting evidence it was decided to limit curve resolution to the three most prominent features only.
However the recent results described by Kristiansson [8] summarised above suggest the tetramer band may give rise to shifts of -650 to -850 cm-1 from the monomer value. The ab initio calculated shifts give support for a much larger shift for the tetramers than the trimers. In the C3 trimer the most intense IR bands in this region are the degenerate e species with a calculated shift of -112 cm-1 and -110 cm-1 for methanol and ethanol respectively; the C1 species has near accidental degeneracy and the corresponding pair of bands are further shifted by -(3-7) cm-1. The third band corresponds to a breathing type vibration with a larger shift but a lower IR intensity. The most intense bands calculated for the tetramers are also e vibrations for the S4 point group and are shifted by -162 and -156 cm-1 for methanol and ethanol respectively. It may be noted that the calculated shift at the HF/6-31G(d) level for the dimer (-56 cm-1) and trimer (-97 cm-1) underestimate the shift assigned to these bands for the dimer (-127 cm-1) and trimer (-286 cm-1) by a magnitude of 2 – 3. It is therefore possible that the calculated shift for the tetramer is consistent with an actual shift of -(300-450 cm-1). A larger shift for the tetramer would be consistent with a stable strongly hydrogen bonded structure similar in stability to those of carboxylic acid dimers. The likely greater strength of cyclic hydrogen bonded forms alcohols was first discussed by Bellamy and Pace [13,14]. This possibility would appear to merit further experimental and theoretical studies.
The application of ab initio calculations using the Gaussian package in the study of alcohols and their associated hydrogen bonded structures is illustrated in Tables 2-5. Tables 2 and 3 summarise previous Hartree Fock calculations using medium size basis sets {HF/6-31G(d) to HF/6-311++G(d,p)}. The absolute values of the parameters are approximate with greater accuracy gained at the higher basis sets; however the energy of the hydrogen bonded systems and the shifts in wavenumber values of the O-H stretching mode is determined as a difference between two values calculated under the same conditions and it is shown that these difference change very little with increasing level of basis set.
Tables 4 and 5 present much more detailed new calculations for methanol monomer. Table 4 compares values for ten basis sets using the Hartree Fock method for the angle and length of the O-H group, for the wavenumber value of the C-O and O-H stretching modes together with the relative intensities in the infrared and in the Raman, the thermodynamic values for zero point (zp), thermal (th), and electronic (e) energies and the dipole moment values It should be noted that the wavenumber values are unscaled and harmonic. It is recommended that Hartree Fock calculations should be scaled by a factor [15] to allow for anharmonicity and other inherent approximations. The major limitation of the Hartree Fock method is that it fails to allow for electron correlation, that is the interaction between two electrons as a function of electron separation. These effects are taken into account to some extent in the Moller Plesset, MP2 method and more so in the Density Functional Theory (B3LYP) method. Calculations by all three methods are included in Table 5 at the lowest and highest basis sets listed in Table 4 (6-31G(d) and 6-311++G(3df,3pd). These provide all 12 normal modes and compare wavenumber values with those measured for methanol in the gas and matrix isolated phase by Serrallach, Meyer and Gunthard [11]. Here the value of the O-H stretch included in Table 5 is corrected for anharmonicity which is reported as -75 cm-1 by Peron and Sandorfy [16]. These Tables indicate that the average difference between measured and calculated wavenumber decreases by 12% between the lowest and highest basis set used in Hartree Fock but by about 30% by the two methods which allow for electron correlation. However this average difference reduces dramatically between HF (-205.6), MP2 (-120.5) and B3LYP (-64.2) at the 6-31G(d) level and is significantly smaller (-181.7, -85.5,and -44-8) at the 6-311++G(3df,3pd) level.
It is therefore clear that more accurate structural and other information is gained by using higher basis sets and methods which take electron correlation into account. These higher level calculations make a considerable demand on computing power. Careful judgement must therefore be exercised in determining when new science requires this resource. Greater ease of transfer of information and data in standard file protocol format should facilitate this process which is illustrated by the problem of the structures and properties of hydrogen bonded forms of alcohols. The calculation of these properties should be in parallel with experimental measurements since mutual stimulation between experiment and theory is the essence of better scientific knowledge
Conclusions
- The evidence from infrared spectra and other physical methods for hydrogen bonding in alcohols is summarised and differences in interpretation discussed.
- Measurement of infrared spectra of methanol and ethanol in solution in CCl4 and ab initio computations are reported over a range of basis sets and provide information on the range of hydrogen bonded species present including cyclic trimers and cyclic tetramers of different symmetries some of which are chiral.
- New information is provided on the effect of basis sets and ab initio methods used for methanol. The average difference between measured and calculated wavenumber deceases by 12% between the lowest and highest basis set used in Hartree Fock but by about 30% by the Moller Plesset and Density Functional methods which allow for electron correlation.
- The average difference between measured and calculated wavenumber reduces dramatically between HF (-205.6), MP2 (-120.5) and B3LYP (-64.2) at the 6-31G(d) level and is significantly smaller (-181.7, -85.5,and -44-8) at the 6-311++G(3df,3pd) level.
Acknowledgement
We are grateful for computing facilities at the Rutherford Appleton Laboratory.
References
- K. M. Menten, C. M. Walmsley, C. Henkel, T. L. Wilson, Astron Astrophys., 1988, 198(1,2) 253.
- G. Winnewisser and E. Herbst, Organic molecules in space, Top cur. Chem. 1987, 139, 119.
- J. R. Dixon, W. O. George, M. F. Hossain, Rh Lewis and J. M. Price, J. Chem. Soc., Faraday Trans. 1997, 93(20), 3611.
- W. O. George, T. Has, M. F. Hossain, B. F. Jones, and Rh. Lewis, J. Chem. Soc., Faraday Trans. 1998, 94(23), 2701.
- J. Errera and P. Mollet, Nature(London), 1936, 138, 882.
- J. J. Fox and A. E. Martin, Proc. Roy. Soc. A. 1937, 162, 419.
- U. Liddel and E.D. Becker, Spectrochimica Acta (Part A), 1975, 10, 70.
- O. Kristiansson, J. Mol Struct, 1999, 477, 105.
- Galactic Grams/386, Galactic Industries Corporation 1995.
- M.J. Frisch, G.W. Trucks, H.B. Schegel, P.M.W. Gill, B.G. Johnson, M.A. Robb, J.R. Cheeseman, T.A. Keith, G.A. Petersson, J.A. Montgomery, K. Raghavachari, M.A. Al-Laham, V.G. Zakrzewski, J.V. Oritz, J.B. Foresman, J., Cioslowski, B.B. Stefanov, A. Nanayakkara, M. Challacombe, C.Y. Peng, P.Y. Ayala, W. Chen, M.W. Wong, J.L. Andres, E.S. Replogle, R. Gomperts, R.L. Martin, D.J. Fox, J.S. Binkley, D.J. Defrees, J. Baker, J.P. Stewart, M. Head-Gordon, C. Gonzalez and J.A. Pople. Gaussian 94 Inc, Pittsburgh PA 1995.
- A. Serralach, R. Meyer and Hs. H. Gunthard, J. Mol. Spect., 1974, 52, 94.
- J.R. Dixon, W.O. George and Rh. Lewis, “The Networking of Infrared Spectrometers and Computers” in “Computing Applications in Molecular Spectroscopy” W.O. George and D. Steele (Eds), Royal Society of Chemistry 1995, p. 61. This uses ChemX, Chemical Design Ltd, Oxford Molecular Group, The Medawar Centre, Oxford Science Park, Oxford OXA 4GA, UK.
- L.J. Bellamy and R.J. Pace, Spectrochimica Acta (Part A), 1966, 22, 525.
- L.J. Bellamy K. J. Morgan and R.J. Pace, Spectrochimica Acta (Part A), 1966, 22, 535.
- J.B. Foresman and A. Frisch, Exploring Chemistry with Electronic Structure Methods, Gaussian Inc, Pittsburgh, PA, 1996, p.64.
- J. J. Peron and C. Sandorfy, J. Chem. Phys., 1976, 65(8), 3153.
Received 28th January 1999, received in revised format 12th April 1999, accepted 16th April 1999.
REF: Int. J. Vib. Spect., [www.irdg.org/ijvs] 3, 2, 5 (1999)