The simultaneous Raman-DSC(SRD) technique using a low-cost fibre-optic probe

13.The simultaneous Raman-DSC(SRD) technique using a low-cost fibre-optic probe
John C. Sprunt and Upali A. Jayasooriya* School of Chemical Sciences University of East Anglia Norwich NR4 7TJ England
*Author to whom correspondence should be sent.
Introduction
The advantages of simultaneously combining two or more analytical techniques to investigate a sample lie in the acquisition of simultaneous sets of data, which gives the possibility of revealing far more structural or chemical information than the individual analyses would separately. In this article, we describe the combination of the techniques of FT-Raman spectroscopy and Differential Scanning Calorimetry (DSC) using a low-cost fibre-optic probe. This allows the vibrational structural information of Raman spectroscopy familiar to readers of IJVS to be combined with the thermal information supplied by DSC (see Section 3). We have given a fuller discussion of this simultaneous FT-Raman-DSC (SRD) technique elsewhere(1). The usefulness of the technique is demonstrated by a study of four of the phases of ammonium nitrate (NH4NO3). These ‘phases’ are different crystal structures which the sample reversibly transforms between. They are stable over different temperature ranges, but irreproducibly so, with the exact temperatures often depending on the sample’s water content and thermal history (i.e. the heating or cooling procedures applied to the sample prior to the analysis).
Similar Techniques in the Literature
Fibre-optics have been used in conjunction with both techniques separately in the past. Frushour and Sabatelli (2) used a fibre-optic probe coupled to a DSC, but in their case used a light-emitting-diode (880nm) with a large number of transmitter and receiver fibres randomly arranged in a bundle, to measure changes in optical transmission of polymers with a photodiode.
Fibre-optic probes have found extensive use in recent years to allow sampling remote from spectrometer sample compartments. Their use in Ultraviolet-Visible emission spectroscopy, visible Raman and, more recently, FT-Raman spectroscopy has been reviewed by several workers(3-7).
Raman spectroscopy and DSC have been performed simultaneously by Harju et al. (8, 9), but their measurements involved vertically mounting a DSC head in the spectrometer sample compartment, requiring substantial mechanical modifications, and pre-melting the samples onto the DSC pans, which gave the disadvantage of destroying the initial crystal structure. Our work using the simple fibre-optic probe required only minimal mechanical modifications to the instruments, and did not require melting of samples.
Differential Scanning Calorimetry
DSC is a thermal analysis technique, normally employing an air-tight heater block containing sample and reference holders. In normal use for solids, a small quantity of sample (around 1-10mg) is encapsulated within a thin, flat sample pan, typically made of aluminium to ensure good thermal conduction by close contact with most of the sample. This is placed in the DSC sample position, and a similar empty sealed pan is placed in the reference position. In power-compensated DSC, both sample and reference positions are fitted with individual heaters and temperature sensors, capable of measuring the difference in power between sample and reference required to maintain both at a given temperature. The normal use of the DSC is to scan the sample temperature up (heating) or down (cooling), whilst measuring this differential heat flow. A DSC curve (or thermogram) is then plotted as differential heat flow versus temperature.
The DSC technique is a very sensitive indicator of energy input to the sample, with thermal transitions such as melting (or fusion) and crystallisation appearing as ‘peaks’ in the DSC curve. The large available temperature range, typically from 77K (liquid nitrogen cooling) to around 1000K means that the heater block must be fitted with an air-tight lid, and purged with a dry inert gas (e.g. nitrogen) to prevent water condensation or sample oxidation. DSC and other thermal analysis techniques have been reviewed by Haines (10).
The Fibre-Optic Probe
The probe design we chose was of the simple ‘six-around-one parallel fibres’ type first reported by Schwab and McCreery (11). The probe is 1.5m long and composed of two branches (bifurcated). A single ‘launch’ fibre carries laser light from the Raman spectrometer’s laser exit port to the DSC. Here, six parallel collection fibres are clustered around this central excitation fibre to collect light back-scattered from the sample (which is necessarily prepared without the usual encapsulating DSC pan cover lid). The collection fibres conduct light back to the Raman spectrometer, where the ‘return end’ is held in the spectrometer’s normal sample position. Figure 1 shows the interconnections schematically. Note that the DSC heater block has been enlarged for clarity.
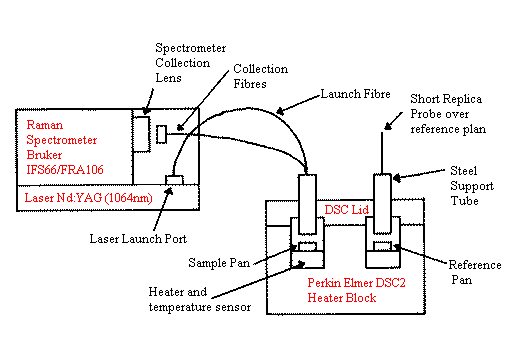
Figure 1. The Simultaneous Raman-DSC (SRD) Fibre-Optic Link shown schematically.
A feature of this simple type of probe is the appearance of a fibre `background’ spectrum, due to Raman scattering and fluorescence in the glass and cladding of the optical fibres, which appears superimposed on the Raman spectrum of the sample. In practice with the samples we have studied, it is found that the background spectrum has a constant shape, and so may be easily subtracted from spectra using the spectrometer software. Figure 2 shows a glass background spectrum used for this purpose, obtained by collecting a Raman spectrum with the probe positioned a few millimetres above a plane mirror. All other Raman spectra shown in this article have had this background subtracted.
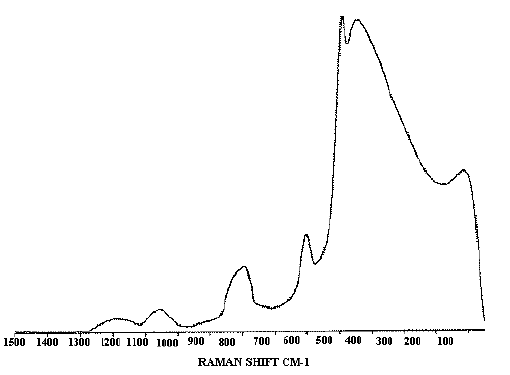
Figure 2. The glass background spectrum characteristic of this probe design.
The fibres used to construct the probe were Ensign Bickford HCP MO600T-08, made of low-hydroxyl glass. Low hydroxyl fibres are commonly used for superior transmission of near-infrared light in communications, and give a much reduced fibre background spectrum. They comprise a 600 mm core surrounded by a 15 mm cladding to provide the necessary total internal reflection. This is in turn surrounded by a strippable protective buffer, bringing the total fibre diameter to 1040 mm. Optical fibres have a characteristic maximum acceptance angle for injection of light relative to the straight-through direction. As a result they not only accept an injected cone of light, but also emit a cone of a similar angle at the far end. This is normally quantified using the numerical aperture. The fibres we used have a high numerical aperture of 0.37. This divergent cone of light gives a low power density, a bonus for probe analysis of heat-sensitive samples.
The fibre’s protective buffer was stripped at the ends of the sample and return bundles. This was to maximise overlap of the light cones of excitation and collection fibres at the sample end, and to bring the fibre axes closer together at the return end to form a smaller optical image for transmission through the spectrometer optics. Use of high numerical aperture fibres also increases this overlap.
To withstand the potentially high temperatures used in analysis of some samples, the probe was constructed using heat-resistant materials. High temperature epoxy was used to seal the stripped fibre ends inside glass support tubes, which were in turn surrounded by stainless steel tubes for structural support.
The choice of 600 mm fibres is a compromise, allowing the probe to be used without any extra optical components at the injection or return ends. The input fibre must be large enough to admit an adequate proportion of the laser power, whereas the return bundle at the spectrometer’s sample position must be small enough for coupling of it’s emitted light through the spectrometer’s collection optics.
The ‘reference’ probe shown in Figure 1 is a short replica probe tip constructed in the same way. It is positioned over the reference pan to balance the heat losses due to the proximity of the probe tip to the sample.
Modifications To Instruments
To interface the probe to the Raman spectrometer (a Bruker IFS66 with FRA106 Raman module), it was only required to construct simple mechanical movements in the spectrometer sample compartment, and to cut openings in the sample compartment lid to lead through the probe branches and allow the movements to be adjusted from outside. An x-y stage was used to position the launch fibre over the laser beam exit port, and an x-y-z stage attached to a modified sample arm for the return bundle.
For interfacing to the DSC (a Perkin-Elmer DSC2), a replica swing-away cover lid was made from aluminium, with holes drilled over the sample and reference pan positions to admit the support tubes of the probe tips. A gas-tight seal was made around the tubes using compression sleeves screwing down onto viton (high temperature) o-rings. The height of the probe tips above the sample and reference pans was set using lockable brass collars attached to the outside of the support tubes.
Operational Method
Discs of ammonium nitrate (Fisons SLR grade) were prepared by pressing approximately 150mg of the powder at 1 ton pressure using an alkali halide disc press. Discs of the DSC pan size (approximately ¼-inch) were stamped out from the pressed disc using a thin-walled stainless steel tube. These were simply placed by hand in the flat-based DSC pans. The encapsulating aluminium cover disc normally used to encapsulate the pan with a crimping device was of course left off, to allow optical access.
The Raman spectrometer laser normally delivers approximately 165mW at the conventional sample position. Probe power throughput at the sample end was maximised to around 55mW (i.e. ~33% transmission) by adjusting the input fibre position at the laser exit port. The return branch was then aligned by placing the sample end against a glass vial containing sulphur powder (which is an excellent Raman scatterer) and adjusting the return bundle position for maximum intensity at the spectrometer. The sample and reference probe tips were then inserted into the DSC, and set to a height of 3mm above the sample pans, which was found to give acceptable spectral intensity with minimal thermal disturbance.
Results For Ammonium Nitrate
Figure 3 shows the DSC curve for an ammonium nitrate sample heated from 310 to 420K at 10K/min. Three endothermic peaks are seen over this range, corresponding to the phase (crystal structure) changes IV > III, III > II and II > I. Heating of the sample was interrupted at the positions shown for isothermal Raman scanning of each of the four phases.
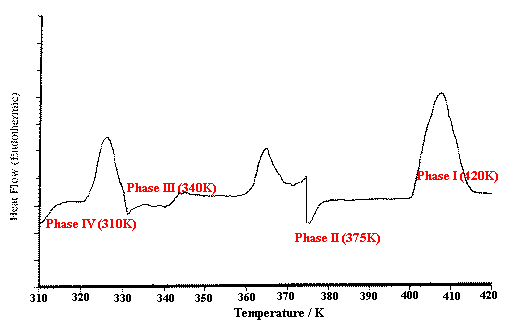
Figure 3. DSC heating thermogram for ammonium nitrate showing endothermic phase transitions
Figure 4 shows the corresponding Raman spectra . Each spectrum used the normal 55mW laser power at the sample, with 1000 scans at 4 cm-1 resolution, taking around 30 minutes to collect each one. The differing crystal structures modify the appearance of the bands in the Raman spectrum, due to the altered symmetry environment of the ammonium and nitrate ions in the crystal unit cells. Significant changes are seen in the low frequency lattice mode region (50-250cm-1). The n4 band at ~720cm-1 splits in phase II, and changes are seen in the relative intensity, frequency and shape of the n1 band at ~1050cm-1. The interpretation is discussed in more detail in Reference 1. An excellent introduction to the ‘Correlation Method’ for predicting the effects of crystal structure on vibrational spectra has been published by Fateley et al.(12).
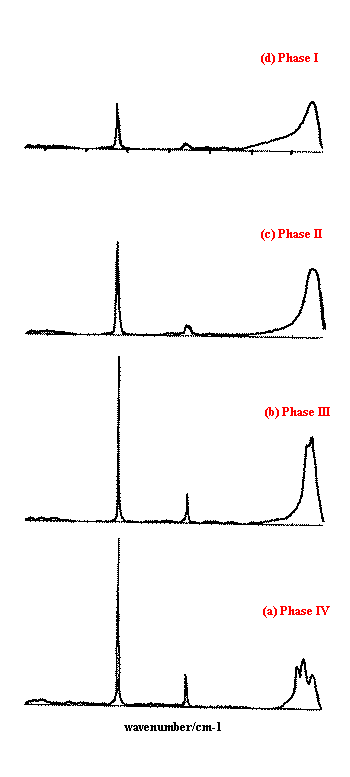
Figure 4. Isothermal Raman spectra of the four studied phases of ammonium nitrate.
Effects of Combined Sampling
Relative to conventionally sampled data, the simultaneous FT-Raman-DSC analysis has a number of effects on the data which must be borne in mind.
Apart from the probe glass background spectrum already mentioned, analysis of samples at raised temperatures gives a broad thermal emission feature in the Raman spectrum at high wavenumber shift. This is due to the detector’s sensitivity to the thermal emission, which is in the near-infrared, and could potentially be avoided by using a system with excitation at a shorter wavelength.
The necessary lack of encapsulation of the sample in the DSC pan leads to broadened transition peaks in the heating curves, which can obscure closely-spaced thermal transitions. For samples such as ammonium nitrate with widely-spaced transitions this is not a problem.
The laser beam from the probe incident on the sample surface has an inevitable heating effect. However, as already mentioned, the laser beam from the excitation fibre emerges as a divergent cone, giving a much lower power density than a focused spot. It’s effect on ammonium nitrate was to lower observed transition temperatures by approximately 2K. The lack of encapsulation on the sample was found to have the opposite effect, raising the observed transition temperatures by up to around 1.5K over the temperature range used. This is attributable to radiative loss of power from a sample at raised temperature.
Application to Other Samples
The simultaneous Raman-DSC (SRD) technique is particularly useful with any sample exhibiting temperature or thermal conditioning-dependent structural changes. Suitable types of compounds include other inorganic nitrates, phthalocyanines and natural products such as biological membranes, triglycerides and cocoa butter. A report on the study of the latter two classes in our laboratory is in preparation.
Acknowledgements
We are indebted to Pat Hendra for jettisoning his old DSC via our laboratory. We also thank Roderick Cannon at UEA and Reg Wilson at the Institute of Food Research (IFR), Norwich, for useful discussions, and EPSRC and IFR for a studentship to JCS.
Editor’s Note: We want it back! The machine with which we replaced the old DSC-2 has now blown up and is irrepairable!
References
- J. C. Sprunt and U. A Jayasooriya, Applied Spectroscopy 51, 1410 (1997).
- B. G. Frushour and D. C. Sabatelli, J. Applied Polymer Science 36, 1453 (1988).
- W. R. Seitz, Anal. Chem. 56, 16A (1984).
- M. L. Myrick, S. M. Angel and R. Desiderio, Applied Optics 29, 1333 (1990).
- S. M. Angel, Spectroscopy 2, 38 (1986).
- N. Q. Dao and M. Jouan, Sensors and Actuators B 11, 147 (1993).
- I. R. Lewis and P. R. Griffiths, Applied Spectroscopy 50, 12A (1996).
- M. E. E. Harju, J. Valkonen and U. A. Jayasooriya, Spectrochimicha Acta 47A, 1395 (1991).
- M. E. E. Harju, J. Valkonen, U. A. Jayasooriya and D. Wolverson, J. Chem. Soc. Faraday Transactions 88, 2717 (1992).
- P. J. Haines, Thermal Methods of Analysis, Blackie Academic Press, London (1995).
- S. D. Schwab and R. L. McCreery, Anal. Chem. 56, 2199 (1984).
- W. G. Fateley, F. R. Dollish, N. T. McDevitt and F. F. Bentley, Infrared and Raman Selection Rules for Molecular and Lattice Vibrations: The Correlation Method, Wiley-Interscience, New York (1972).
Received 29th May 1998, received in revised format 4th June 1998, accepted 5th June 1998.