Time resolved FT-IR of liquid crystalline 5CB in electric fields
14. Time Resolved FT-IR of Liquid Crystalline 5CB in electric fields
J.C.Leyte* and P.C.M. Woerkom#
* Leiden Institute of Chemistry,
Dpt of Physical and Macromolecular Chemistry,
Leiden University
P.O. Box 9502, 2300 RA Leiden,
The Netherlands
# Akzo Nobel Central Research
P.O. Box 9300, 6800 SB Arnhem,
The Netherlands
Abstract
Time resolved spectra of 5CB in the msec domain were obtained during excitation with electric fields of different time dependence: ac, constant dc, ac + dc. The response to ac excitation occurs mainly at twice the modulating frequency. The effect of the addition of dc to an ac field is the induction of an additional response at the ac frequency. The amplitude of the oscillating responses diminishes with increasing ac frequency. This is in accordance with the expected response to the torque exerted by the ac field. The additional ‘single frequency’ response persists indefinitely even though the response to the application of permanent dc relaxes within roughly 200 msec. With increasing ac frequency this response decreases faster than the double frequency response. Different functional group absorptions respond without a significant phase difference in this time scale.
Introduction
Modern FT-IR is a versatile technique offering a broad range of exciting and fruitful applications. Now that stepscan is a routine scanning method, the time evolution of numerous processes can be followed on a molecular scale. Individual functional groups can be monitored and their time dependent behaviour can be studied. Increasing the experimental effort from routine to high level, the time scale may be diminished from the millisecond and the microsecond to the nanosecond range.
The present report addresses the response of liquid crystalline 5CB to electric fields.
The IR-observed response of liquid crystals to the application of electric fields has been discussed in a number of papers, a selection of which is cited in the references. In frequency domain work, the amplitude and phase of the response to a monochromatic ac excitation is studied [1, 3, 7]. In time domain studies the time resolved response of a sample to an excitation in the form of a pulse or a burst is obtained [2 – 6]. Because IR is a technique that probes functional groups in molecules, considerable attention has been directed at the question whether a phase lag between the rigid ‘head’ and the flexible ‘tail’ of 5CB was indicated by the results in the frequency domain and the time domain.
Recently [7], it was found in a frequency domain study that the major response of nematic liquid crystalline 5CB to an ac excitation at frequency w occurs at twice the excitation frequency, i.e. 2w . This is typical for a material in which the dynamic unit that couples to the field has no permanent dipole. Coupling of the ac field to the induced moment then leads to oscillations at 2w . The molecules in 5CB posses a large permanent dipole moment. The dynamic unit observed with IR in the millisecond range is, therefore, not the single molecule. A consistent interpretation could be developed in terms of a locally defined director and a local polarizability, which is an averaged property, i.e. averaged over molecular motions fast with respect to the millisecond timescale of the experiment. A response at w could be obtained by application of an additional offset voltage during excitation.
A maximum in the response divided by the square of the field amplitude is expected from this model if the response is obtained as a function of the field amplitude. In a subsequent study the occurrence of the maximum at the expected average orientation of the director was found [8]. Also, the time resolved trace of the CN absorption of 5CB was obtained while the sample was submitted to an ac excitation. In this way the response at 2f could be directly shown.
In the present report the possibilities of this type of time domain experiment are explored somewhat further. The amplitude of the director oscillations as a function of the frequency, the response to a sustained dc excitation, and the response as observed from different functional groups are discussed.
Experimental
Commercially available 5CB, 4-pentyl-4’-cyanobiphenyl, (Merck), was used between windows from Si wafers coated with poly-imide and gently rubbed with cloth to obtain orienting surfaces. The Si windows also serve as electrodes for the application of electric fields.
In stepscanning, the optical path difference is not changed continuously in time but stepwise; i.e. each path difference used is maintained for a time interval D t, which may be chosen. During this interval the basic time dependence of the signal, necessary to drive the detector efficiently, is induced by oscillation of the static mirror (phase modulation). A second type of time dependence is created by manipulation of the sample: this is the experiment. The experiment is cyclical and it is duplicated at every optical retardation. This time dependence is registered by storage of the demodulated signal in a number of consecutive channels. The signals in the channels with the same ‘number’ but at different optical retardations form the interferogram for this instant of the experiment.
A Biorad FTS60A spectrometer with MCT detector was used in stepscan mode. Phase modulation was at 400Hz with an amplitude of 2 Ne laser fringes. A wire-grid polarizer was positioned between the source and the sample. The phase modulated IR signals were demodulated with a SR830 lock-in amplifier from Stanford Research Systems. The electric field applied to the sample was obtained from a HM8130 signal generator from HAMEG. At each optical retardation an excitation and relaxation of the sample was executed while collecting the detector signal at (usually) 2.5 ms intervals. Standard software was used to obtain the interferograms from this data set.
Results and Discussion
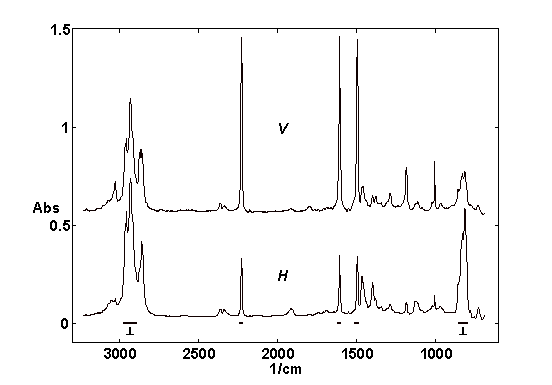
Figure 1. 5CB, polarizer directions Parallel and Perpendicular to the uniform planar orientation direction. Res=4 cm-1 . Integration regions for bands discussed are indicated as are the bands with the main absorption perpendicular to the director. The central frequencies of the regions are: 2930, 2226, 1605, 1495, 1460, and 825 wavenumbers.
Figure 1 shows spectra of 5CB for two polarization directions of the IR beam: parallel (V) and perpendicular (H) to the uniform planar orientation direction. The spectral regions that are particularly useful for analysis of the dynamic behavior of the liquid crystal are indicated. Bands indicated as perpendicular have the largest component of the absorption tensor perpendicular to the director and an increase of absorption intensity is observed for these bands if the director reorients from parallel to the orienting windows to perpendicular, e.g. under the influence of an electric field.
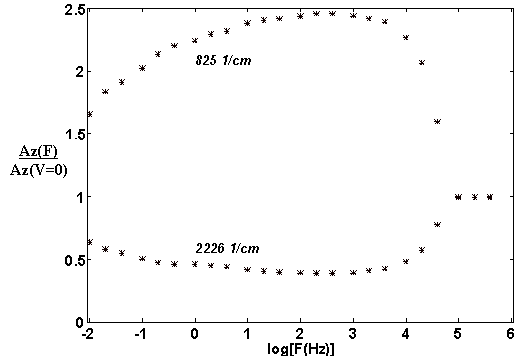
Figure 2. Frequency dependence of the average response of 5CB to ac excitation at 6V amplitude. Res = 2 cm-1, speed = 20kHz.
In Figure 2 the average (i.e. averaged over the ac oscillations) response of two IR absorptions of 5CB is shown to depend of the frequency of the electric field. The spectra were obtained in normal scanning mode, averaging over many periods of the applied ac field. The increasing response with increasing frequency up to roughly 200Hz is thought to be due to the diminishing polarization of the electrodes (i.e. the cell windows). The time constant associated with the electrode polarization is then about 100 ms for this sample. The exact shape of the frequency dependence in this region depends of the specific sample: if the cell is not dried carefully no response may be observed up to 1Hz.
The average orienting effect of the electric field disappears in the 10 kHz range. In contrast to our previous remarks [9] we can now conclude that this dispersion does not reflect a property of the liquid crystal itself. In recent experiments we observed the polarization of the liquid crystal to be stable right into the MHz region when using Ge instead of Si windows/electrodes.
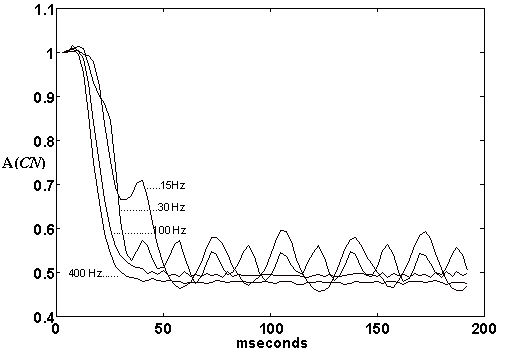
Figure 3. Frequency dependence of the time resolved response of 5CB at 2226 cm-1 (CN) to ac excitation at 6V amplitude. Res = 8 cm-1, scans=2, 2.5 Hz stepscan. Modulation cycle:
[200 msec 0 V / 200 msec 6 VSin(F)]
Figure 3 the time-resolved response of 5CB is shown for 6V-ac excitation at a number of frequencies. The response to ac excitation occurs mainly at twice the modulating frequency (in the figure this is only observable for the two lower frequencies). The TRS trace for the lowest frequencies shows an additional oscillation at the ac excitation frequency. This may be due to the fact that in this frequency region polarization effects are still important, as seen in Figure 2. At constant field amplitude the oscillation amplitude is seen to decrease sharply with increasing frequency although the average response increases in this range. This may be understood by considering the driving torque. For a simple model it is found [9] that the amplitude of the director oscillations is proportional to the inverse of the frequency of the driving electric field.
It is noted that the director oscillations decrease in a frequency range where the polarizability and therefore the susceptibility of the nematic 5CB are still effective as seen from the average orientation of the director in Figures 2 and 3.
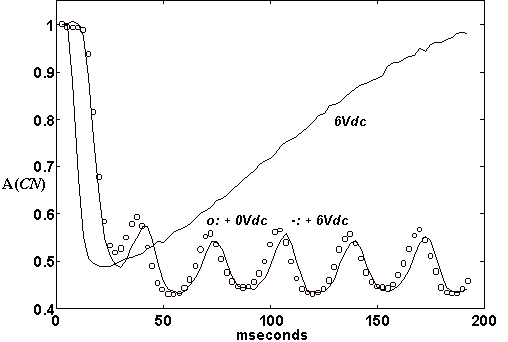
Figure 4. Response of 5CB to 6V dc, 6V 15Hz ac, and the combined excitation of 6V dc and 6Vsin(15). Res = 8 cm-1, scans = 1, 2.5 Hz stepscan. Modulation cycle: [200 msec 0V / 200 ms excitation]
Three experiments are depicted in Figure4: the time response of 5CB to a continuing dc excitation, and the responses to an ac field with and without an additional dc field. The response to the dc field shows the well known short rise time but it does not persist, probably due to electrode polarization effects which are seen to build up with a time constant of roughly 100 ms. This is in accord with the result shown in Figure 2 where the frequency dependence is seen to weaken above 10 Hz, i.e. when the time for polarization buildup becomes to short. Consistently the effect of an additional dc field on a sample, which is excited at 15 Hz, is seen to be marginal in Fig.4. A persistent effect of the additional dc field is only to be expected if the period of the ac field is larger, or at least not much smaller than the time constant of the electrode polarization. In that case a non-symmetrical perturbation of the electrode polarization by the ac field may produce a net extra dc field component and the associated induced static moment can couple with the ac field and produce director oscillations at the ac frequency w in addition to the 2w response.
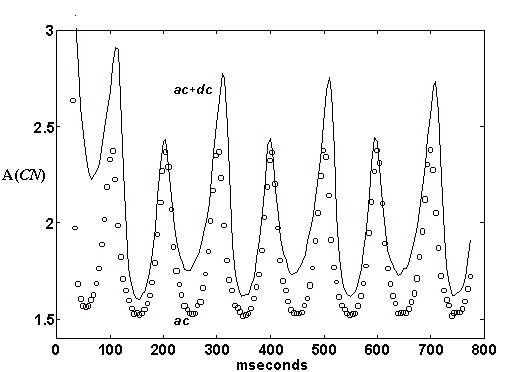
Figure 5. Response of 5CB to 6V 6Hz ac and to 6V dc + 6V 5Hz ac.res = 8 cm-1, scans = 1, 1 Hz stepscan. Modulation cycle: [10 msec 0V / 990 ms excitation]
The influence of an additional dc field on a sample that is excited at low ac frequency (5 Hz) is shown in Figure 5. Here it is seen that the presence of the dc field induces a significant extra oscillation at the ac frequency whereas in its absence only twice the ac frequency is observed in the response. It is noted that the single ac frequency response persists indefinitely even though the direct response to a dc field without an additional ac field dies out as shown in Figure 4.
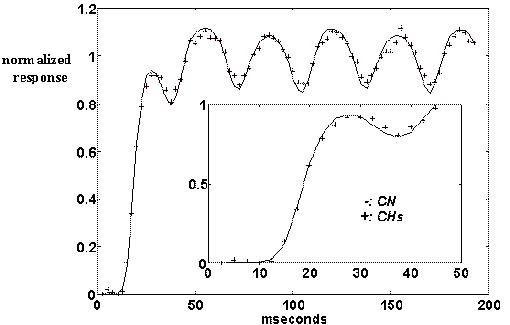
Figure 6. TRS of 5CB: CN and alkyl CH-stretch absorptions. Res = 8 cm-1, scans = 1, 2.5 Hz stepscan. Modulation cycle: [200 msec 0 V / 200 msec 6V amplitude at 15.25 Hz]
In Fig.6 the time resolved response of different functional groups are compared: the aliphatic CH-stretch and the CN absorptions. The former absorbs mainly perpendicular to the director and the latter is a parallel band. The absorptions respond without a significant phase difference in this time scale, confirming that director dynamics are probed rather than individual molecular behavior. The director oscillations seen here are of course smaller than the director excursions generated by large field pulses. In the present experiment the average director orientation is constant. We demonstrated the absence of intra molecular phase differences in the msec domain already in frequency domain studies. In the msec domain the information obtained about the dynamics of the liquid crystal is independent from the particular functional group that is observed. Recent NMR [10] work on 5CB, slowed down by the presence of 5.4 wt % of a block copolymer, indicates that the same conclusion is valid in this composite system.
Conclusions
Time resolved monitoring of the response to persistent perturbations is a useful way to to examine the dynamics of liquid crystals, using signals from different functional groups in the molecules. Intra molecular differences in dynamical behavior were not observed in these experiments, in accordance with our earlier results. The decrease of the amplitude of the director oscillations with increasing frequency of the driving electric field is explained.
References
1. V.G. Gregoriou, J.L. Chao, H. Toriumi and R.A. Palmer, Chem. Phys. Letters, 179, 491, (1991)
2. H. Sugisawa, H. Toriumi and H. Watanabe, Mol. Cryst. Liq. Cryst. 214, 11, (1992)
3. T.Nakano, T. Yokoyama,and H. Toriumi, Appl. Spectrosc. 47, 1354, (1993)
4. T. Urano and H. Hamaguchi, Appl. Spectrosc. 47, 2108, (1993)
5. S.V. Shilov, S. Okretic and H.W. Siesler, Vibrational Spectroscopy, 9, 57, (1995)
6. M.A. Czarnecki, N. Katayama, M. Satoh, T. Watanabe and Y. Ozaki, J.Phys.Chem. 99, 14101, (1995)
7. J.de Bleijser, L.H.Leyte-Zuiderweg, J.C.Leyte, P.C.M. van Woerkom and S.J. Picken, Appl. Spectrosc. 50, 167, (1996)
8. J.C. Leyte and P.C.M. van Woerkom, Appl. Spectrosc. 51 (1997) 283-284
9. J.C. Leyte and P.C.M. van Woerkom, Appl. Spectrosc. 51 (1997) 1711-1714
10. E.Campi, J.W.Emsley, R.Luckhurst, B.A.Timimi, G.Kothe and M.Tittelbach, J.Chem.Phys., 107, (1997),5907.
Received 8th April 1998, received in revised format 8th June 1998, accepted 9th June 1998.

