Diffuse Reflectance for the Routine Analysis of Liquids and Solids
Alexander Shchegolikhin and Olga Lazareva
For many years transmission IR-measurements were the most popular because of their apparent simplicity. Thus, the KBr pellet and Nujol mull techniques have become established methods for the analysis of solid samples, while IR cells or cuvettes have been standardly used for the investigation of liquid samples. However, certain classes of organic compounds and polymers can undergo structural or chemical changes when they are ground with the alkali halide powders that are most commonly used for transmission IR experiments. Specifically, solid-state ion exchange can occur between the alkali halide matrix and the analyte, broadening or shifting spectral bands. This is brought about by the extreme pressures and temperatures generated locally when sample and matrix are ground together and pressed into a pellet. Alkali halides under the pressures required to form a clear pellet are actually liquid, increasing the likelihood of ionic exchange. The pressures and temperatures of grinding and pressing some samples with a diluent can cause other effects unrelated to the matrix. Certain crystalline compounds and polymers have several structural phases that interconvert under temperature and pressure.
27. Diffuse reflection requires that an infrared beam illuminates a powdered sample and that the system collects light over a wide range of angles excluding the specular reflection angle. We have used commercially available DRIFT accessories for several years and two of them are illustrated below.
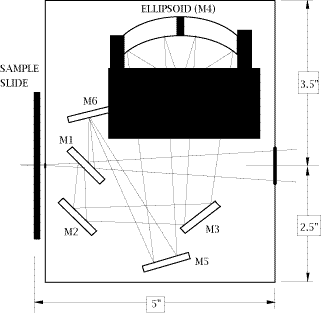
28. An optical diagram of the Perkin-Elmer Diffuse Reflectance (PEDR) accessory is shown in Fig.1. This accessory is mounted in the spectrometer sample compartment by placing its side slide support into the sample slide holder of the instrument. Access to the sample is accomplished from the front of the attachment by sliding the sample holder horizontally toward an operator. The sample height is fully adjustable by means of a single focus adjustment knob. The PEDR accessory design, shown in Fig.1, uses five flat reflectors, one of which (M1) is double-sided. It uses one aspherical reflector (M4), which both focuses the incident beam on the sample and collects the reflected beam with 8X condensation power. The collecting angle of the PEDR accessory is a full pi steradians, so that it is able to collect approximately 50% of the reflected energy. The angle of incidence is 38° [11].

Figure 1: Schematic layout of the Perkin-Elmer PEDR Diffuse Reflection Accessory
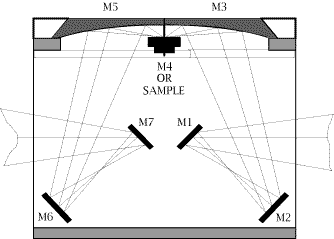
29. Although it is not obvious in the diagram, the sample is tilted out of the plane so that the specular reflection misses the ellipsoidal collector. An optical diagram of the other DRIFT accessory used in our work, “The Collector” from the Barnes Analytical Spectra-Tech, is shown in Fig.2. The design employs 4 flat and 2 aspherical reflectors. The aspherics are off-axis ellipsoids which focus and collect infrared energy with 6X condensation of the beam. The collection angle is a full pi steradians, collecting about 50% of the available reflected energy. The fixed mean angle of incidence is 50°. The accessory is mounted onto the bottom of the sample compartment of the spectrometer.

Figure 2: Schematic layout of the SpectraTech “COLLECTOR” Diffuse Reflection Accessory
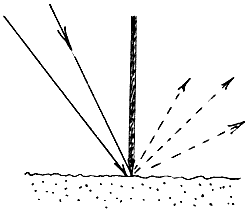
30. Here again the sample is tilted to avoid the specular component. Some of the accessory makers use a blade to discriminate the diffuse from the specularly reflected light. The idea is as below

the radiation must pass beneath the blade and hence through the powdered sample. Barnes provided a ‘Blocker’ i.e. a small gold coated blade, which can be placed across the sample surface during normal diffuse reflectance experiments.
31. Access to the sample is from the top, by sliding the ellipsoids out of the way. The sample height is fully adjustable by the adjustment micrometer screw.
All diffuse reflectance systems involve concentrating the beam from the interferometer onto the sample and collection over a wide angle for onward passage to the detector (Ideally the HgCdTe cooled super-sensitive device rather than the normal routine DTGS detector).
The laws of optical physics hence require that the area viewed on the sample surface is smaller than the normal beam cross-section in the sample area.
32. The Perkin-Elmer 1725-X FTIR beam has an 8mm spot size at the focus, so the spot sizes with the DRIFT accessories are 1.0mm and 1.3mm for the PEDR and the “Collector” respectively.
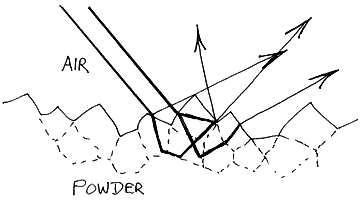
In diffuse reflection it is essential that the infrared beam enters the sample. It has to be bounced around beneath the surface in order that absorption can occur before it leaves the surface for collection and subsequent analysis. To achieve this, powdered samples are almost invariably examined.

33. Neat powders often absorb far too strongly – remember the path followed by the radiation through the specimen is quite long. As a result, it is normal to dilute a specimen with an infrared transparent powder – say KBr. The concentration of sample is quite low. Organics are usually diluted with KBr over a wide range of concentration, 10% down to 0.5% are quite usual, but inorganics seem to work well over a narrower concentration range, around 1%. However, to get good spectra the grinding and mixing must be really carefully done. The subject is well covered in the literature [1].
Solid lumps like polymers cannot be sampled by grinding and dilution. In these cases abrasion with course silicon carbide abrasion paper is the solution. The accessory makers supply small paper discs with an open texture coated with SiC. These are lightly rubbed on the specimen and then examined. The amount of powdered material stuck to the abrasive sheet is very small, so no dilution is required – the discs are examined as they come. The SiC does not interfere in the spectrum.
34. With care and skill a wide range of problems have been tackled with diffuse reflection. Since its introduction in 1978 by Fuller & Griffiths [1], it has been employed to characterise the molecular orientation in injection-molded polymeric products [2], to study the light-induced yellowing of paper [3], for surface analysis of polymer films [4], polymer fibers [5] and glass fiber mats [6,7], for the analysis of functional groups in polymer films [8], or for the determination of crystallinity in fiber reinforced composites [9,10].
The main limitation in sampling in DRIFT accessories is space – the sample stage must be small and lie close to the collector mirror.
35. However, accessory manufacturers are ingenious and they have produced many clever sampling stages over the years, enabling users to heat or cool samples. Perhaps the most elaborate encloses the sample in a stainless steel cell with ZnSe windows. The sample inside can be exposed to vacuum or gases and it can be heated. The whole cell is very small ~30mm in diameter and 20mm high. Using these devices, a wide range of catalytic studies have been reported.
Examples are the reduction of NO by ammonia over vanadia – titania areogels [11] and reactions between CO+H over complex alumina catalysts [12].
36. When it was introduced, DRIFT was predicted to make significant progress in routine analysis. It seemed to be simpler and quicker than transmission methods and it was thought to be really versatile. The latter has been so, but for routine use there is a major weakness; the quality of the spectra recorded requires considerable skill. The grinding and mixing with diluent, the concentration, and the way the mixture is loaded into the cup which holds it in the accessory, are all important. The abrasive disc method must be carried out carefully. So, as an analytical tool DRIFT is excellent but it has tended to be confined to the specialist user – the skilled analytical spectroscopist or the research worker.
We have more recently developed a variant of DRIFT. Using the normal diffuse reflectance accessory, we examine samples in a specular mode, but for solids we do not get specular reflection spectra. Sounds confusing, doesn’t it – SO, please read our paper at para 95.
We have called our method DRAFT.
37. References
1. M.P. Fuller and P.R. Griffiths, Anal. Chem., 50, 1906 (1978)
2. J.A.J.Jansen, J.H. van der Maas and A. Posthuma de Boer, Macromolecules, 1991, 24, 4278-420;
J.A.J.Jansen, W.E.Haas, Polym. Commun., 1988, 29, 77
3. A.J.Mitchell, P.J.Nelson and C.P.Garland, Appl. Spectrosc., 1989, 43, 1482-1487;
A.J.Mitchell, C.P.Garland and P.J.Nelson, J. Wood Chem. Technol., 9(1), 85 (1989)
4. S.R.Culler, M.T.McKenzie, L.J.Fina, H.Ishida and J.L.Koenig, Appl. Spectrosc., 1984, 38, 791
5. R.T.Graf, J.L.Koenig and H.Ishida, in Fourier Transform Characterization of Polymers, H.Ishida, Ed. (Plenum, New York, 1987), p. 397
6. R.T.Graf, J.L.Koenig and H.Ishida, Anal. Chem., 1984, 56, 773
7. M.T.McKenzie, S.R.Culler and J.L.Koenig, Appl. Spectrosc., 1984. 38, 786
8. P. de Donato e.a., J. Polym. Sci., B. Polym. Phys., 1992, 30(12), 1305
9. K.C.Kole, D.Noêl and J.J.Hechler, J. Appl. Polym. Sci., 1990, 39, 1887-1902
10. K.C.Kole, D.Noêl and J.J.Hechler, Polym. Compos., 1988, 9, 395
11. H.Schneider, S.Tsuchudin, M.Schneider, A.Wokaan and A.Baiker, J. Catal., 1994, 147, 5-14
12. J.J.Benitez, I.Carrizosa and J.A.Ordizola, Appl. Surf. Sci., 1995, 84, 391-399
REF: Int. J. Vib. Spect., [www.irdg.org/ijvs] 1, 4, 26-37 (1997)
