The Application of a DRIFT Accessory for routine analysis of Liquids
95. The Application of a Drift Accessory for Routine Analysis of Liquids and Solids
Alexander N. Shchegolikhin and Olga L. Lazareva
Department of Electronics of Organic Materials, Joint Institute of Chemical Physics
Russian Academy of Science, 4 Kossygina st., Moscow, 117334, Russia
96. Abstract
| A modification of the normal sample stages of two standard Diffuse Reflection (DRIFT) accessories along with relevant changes to the sample application techniques are reported. These simple modifications are shown to increase the applicability of conventional DRIFT accessories, allowing qualitatively correct Diffuse Reflection-Absorption (DRAFT) spectra of liquids and solids to be obtained routinely and with high sample throughput. To illustrate the feasibility of the modified technique for routine identification purposes, DRAFT spectra are compared with those which have been recorded in transmission. The effects of the sampling methods on the quality of the DRAFT spectra are discussed in terms of possible optical distortion of the latter. A phenomenological explanation of the apparently good correspondence between the DRAFT and the standard transmission spectra is proposed. |
97. Introduction
Since its introduction by Fuller & Griffiths in 1978 [1] DRIFT has made a considerable impact in that the technique is versatile and sampling relatively undemanding. It has proved to be valuable in some aspects of routine analysis and also in more specific areas such as polymer [2-10] and catalytic science [11]. For routine analysis it does however involve dilution procedures and careful compaction of the powder into the sample cup.
In this paper we describe a method, not completely novel, but one which has in our hands proved itself to be of great value in routine analytical infrared spectroscopy. It uses a variant on diffuse reflection and transflectance and we abbreviate its title as DRAFT (Diffuse Reflection Absorption Fourier Transform spectroscopy).
98. Experimental
In our work we used two DRIFT accessories, one from Perkin Elmer, the other Barnes Spectra Tec and described elsewhere [12], and a model 1725X FTIR instrument from Perkin Elmer. In each case, the complete sample holding assembly (and in the case of the Barnes accessory, the blocking blade) was removed and replaced by a special sample holder. See para 28 this edition.
99. Modified sample holder
Small stainless steel platens, which are shown schematically in Fig.1, were simply placed into the DRIFT accessories sample positions instead of the standard DRIFT sample cup and were used throughout this work.
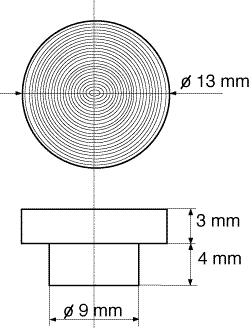
Figure 1: Schematic view of the modified DRAFTsample holder machine tooled from stainless steel
The platens are flat and act as mirrors but they do show concentric scratches on their surfaces under the microscope. They were degreased with acetone and detergent/H2O prior to drying in the oven [13-15]. The platen is placed in the DRIFT accessory in the specular reflection orientation* i.e. all the incident beam reflected and scattered off the platen is collected and passed to the detector.
*All DRIFT accessories provide a facility for samples to be placed in either the diffuse reflection mode (where specular reflection is deliberately avoided) or the specular reflection orientation. It is normal to align the accessory in this latter configuration and it may or may not be used by spectroscopists in this mode when analysing a sample.
100. Sample preparation
Soluble solids
Solutions of soluble solid analytes were prepared by dissolving in an appropriate solvent to obtain a 1-10% by weight concentration of the solid. Throughout this work the choice of the solvent was dictated primarily by the solubility of the analyte (the problem of the solvent related polymorphism of solid samples will be addressed later). With readily soluble solids the more volatile and harmless solvents were preferred. Drawn glass capillary, of 0.5-1.0 mm diameter, or 10-100 µl micropipettes with disposable poly(propylene) tips were used to transfer sub-microliter portions of the solution onto the surface of the metal sample platen. The glass capillary with an evenly cut end seems to be more useful than the micropipette. The sub-microliter portions of an analyte solution were deposited onto the central part of the reflecting surface of the metal platen by repeatedly touching the surface with the filled end of the capillary or the micropipete tip. Depending on the volatility of the solvent used, the metal platen was then placed directly onto the sample post of the DRIFT accessory as soon as the solvent had evaporated, or it was put aside to permit complete evaporation. Drying in a vacuum oven at 30 to 50°C, to remove residual solvent, turned out to be good practice, though not strictly necessary in the case of low boiling and highly volatile solvents. After solvent removal, a mosaic coverage of the metal surface appeared with clearly visible interconnected “spots” of highly particulate solid matter. More elaborate methods of forming film-like deposits of solids, sometimes known as “doctor blading”, and also spinning were tested, but gave no apparent improvements in results compared to the simplest capillary method outlined above.
Liquids
The liquid analytes were applied onto the sample metal platen neat using the same capillary method. After application of a sub-microliter drop of a liquid onto the metal surface, some liquids spread out producing a thin capillary film and their spectra were run directly. Some liquids and “oils”, having a limited wetting ability or high viscosity, after capillary deposition were spread across the surface of the metal platen by “doctor blading”[16].
Insoluble solids
Minute quantities of these were applied directly onto the centre of the stainless steel platen surface and then crushed thereon using an appropriate hard tool. One needs just to stain the surface of the platen with powder-like particles of the solid analyte. Removing the most “bulky” pieces of the crushed sample turned out to be good practice.
101. Measurements
All measurements were performed using a 4cm-1 resolution and a normal apodisation function. The number of accumulated scans depended mainly on the nature of the sample. Typically, 10-50 accumulations were sufficient to obtain quite satisfactory results with the DTGS-detector during analysis of solids and oils, while only 10-20 scans were accumulated when using the MCT-detector for the analysis of volatile liquids. The position of the sample holder in the accessory was always optimised before the background run using a clean metal platen. Positional optimization was performed by maximising the IR-energy gathered by the DRIFT accessory. Usually the total energy gathered by the accessory with a clean platen amounted to 45-50% of the value characteristic for the “open beam” condition. Using a clean platen, the background file was obtained shortly before acquisition of the spectrum of a sample. To improve the representativeness of the background in each experiment, sample spectra were recorded using this platen, it being placed on the sample post of the accessory in exactly the same orientation as for the preceding background run. To facilitate this, a pair of dot markers were inscribed on the sample post of the accessory and on each metal platen.
- Comparative measurements by normal DRIFT
These measurements were conducted using the standard sample cup and powdered KBr as a diluent as recommended in the literature [1,11,12].
- Comparative measurements in transmission
Measurements in transmission were taken using the Sample Shuttle device working in the auto interleave mode. For comparison of spectra obtained by means of the modified DRAFT technique with those obtainable in transmission, the same analyte was measured using the standard KBr disk technique.
- Library search
To illustrate the usability of the modified DRAFT technique, the Perkin-Elmer “PC-Search” program and the “Fluka” spectral library, working under Perkin-Elmer “IRDM” software, have been used throughout this work. Additionally, Aldrich FT-IR Peak Search Computer Software along with an Aldrich Library of FT-IR Spectra [17] have been extensively used for semi-automatic library search and visual comparison of the acquired reflectance spectra with the standard ones recorded in transmission.
102. Results and Discussion
Although the accessory manufacturers claim that DRIFT is a simple, routine and versatile technique, it is our experience that to examine a really wide range of samples, considerable skill and experience are required if first class results are to be obtained. In some cases the abrasive disc technique will be indicated, in others grinding and dilution with KBr. The results obtained are strongly dependent on the sample, its morphology, its optical properties, and the technique of sample preparation used. In fact the thesis that the DRIFT technique “involves little or no sample preparation” is far from reality.
To demonstrate this point, in Fig.2 we offer a spectrum of a diacetylenic 24-hexadiyne-1,6 diol (HDD) acquired by different IR techniques. This compound is a readily crystallizable solid exhibiting good solubility in many polar organic solvents. The top spectrum is a Fluka library one, the bottom spectra was recorded using DRIFT (and we must emphasise that care was used to obtain the “best” results). Between these, we offer the DRAFT spectrum.
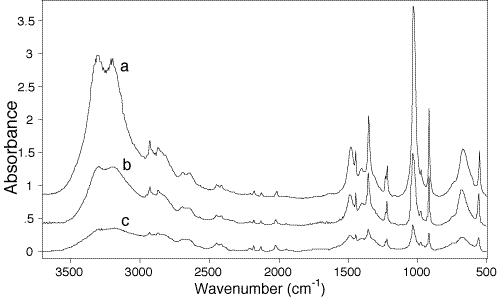
Figure 2: Comparision of transmission library (KBr-disk) (a), modified DRA (b) and conventional DRIFT (c) spectra of 2,4-hexadiyne-1,6-diol. All spectra have been normalized by 2119 cm-1 band, and spectra b and a are shifted by 0.4 and 0.8 Absorbance units relative to c for clarity, respectively.
103. It can be seen that in general terms all these spectra are rather similar, and any one of them could be used for identification purposes. However, it is apparent that the spectra obtained by reflectance (b and c), while having considerably lower intensity in general, seem to have “less contrast” as compared to the transmission one, a. Actually, one can see some overall intensity redistribution of the absorption bands between all these spectra. This result is not surprising in view of the different optical geometries used in each of the measurements. Spectrum a is normally considered to be the standard, and will be used as a reference in the following discussion. Spectrum c, being obtained by the conventional DRIFT, should be of help to illustrate the peculiarities of the modified DRAFT technique.
Obviously, the reflectance technique described in this work could not be referred to as conventional diffuse or as a purely specular reflection, though both regimes are operative here to some extent. At the same time, owing to the highly irregular profiles of the front surface of the sample and of the reflecting surface of the metal platen, it should differ from the conventional reflection-absorption technique (FT-IRRAS) at least in terms of the proportion of diffusely processed light.
Conventional FT-IRRAS is well known as a surface sensitive technique which is useful for the analysis of thin films on prepolished metallic mirrors, and is frequently based on the use of polarized IR-light at grazing incidence [18-21]. The reflectance technique described in this work is based on unpolarized light, moderate angles of IR-light incidence, comparatively thick effective layer of sample, and microscopically uneven metallic support surfaces.
104. For the sake of further discussion it is appropriate to remind ourselves here that the conventional DRIFT technique is primarily intended for samples that cannot be handled by transmittance, that is, for IR opaque or highly scattering materials, or those that would be sensitive to more traditional preparations, e.g. KBr disks. The only restriction was that the sample must be powdered. By definition, diffuse reflectance spectroscopy is a technique where source radiation strikes a powdered sample and passes into the material, undergoing refraction (transmission/absorption), reflection, diffraction, dispersion, and scattering before re-emerging at the surface. This weak diffuse radiation, emerging at all angles to the surface of the sample, is then collected in a manner which minimizes the specular reflectance component. The quality of the diffuse reflectance spectra is strongly dependent on the particle size and sample concentration. Good results are expected to be achieved using the dilution method and by reducing the particle size (d << λ). It is widely accepted that these precautions help to avoid or greatly reduce specular reflectance, which otherwise leads to distortions in the recorded spectra. Generally, in order to get reproducible results, a reasonably constant particle size, a homogeneous and constant dilution, as well as reproducible filling of the sample cup, are required [22,23]. The majority of reported DRIFT spectra have been obtained from fine powders dispersed in non-absorbing matrices such as KCl or KBr. In general terms, diffuse reflectance spectra obtained under these conditions are considered to be similar to transmission spectra of the same materials but inevitably should suffer from intensity redistribution, and therefore may require a correction by means of the well known Kubelka-Munk formulae.
Returning now to Fig.2, one can see that the DRAFT spectrum (b), as compared to the transmission measurement (a), does not show any apparent band shape distortions due to possible intense specular reflections. (Actually, the conventional DRIFT spectrum (c) does contain two such artifacts near 3350 and 1400 cm-1).
105. To compare DRIFT and DRAFT we must reconsider the processes involved:
- In the DRIFT experiment, radiation falls on the finely powdered specimen. The particles are predominantly those of the diluent (usually KBr) and they are small (typically ~1µ in diameter). As a result, scattering occurs as the light leaves the surface over a wide range of angles and also passes down into the surface of the powder. After transmission and further scattering, much of this radiation leaves the surface again over a wide range of directions. It must be remembered that in DRIFT, no attempt is made to compress the particles together or to immerse them in a mulling fluid – scattering is deliberately encouraged off the air/sample and air/diluent interfaces. The total collected radiation is predominantly (but not exclusively) of a similar character to an absorption spectrum.
- In DRAFT, a somewhat similar set of processes occur but the balance of their importance is different. Light falling on the surface is scattered but the scattering is exclusively off the sample, no diluent is used. Much of the light passes through the very thin finely divided specimen, hits the metal platen, and is specularly reflected again through the specimen and away from the surface. The finely divided nature of the specimen diffuses the reflection so that it occurs over a wide range of angles. The collected radiation, as in DRIFT, is a mixture of radiation attenuated by reflection and by absorption and the latter predominates. Thus, the spectrum appears to be similar but not identical to an absorption spectrum.
The inherently different character of the spectrum derived from reflection off an absorber, compared with a true absorption spectrum, means that in both DRIFT and DRAFT the experimentally collected result will always be a perturbed “version” of the conventional absorption result. However, as we shall see, with reasonable care in sample preparation, the reflection component can be relatively weak enough that the experimental spectrum ‘looks’ like an absorption one and can hence be easily recognised by library search routines.
106. The ideal DRAFT sample should be of thickness such that a spectrum in the range 0.1-1.5A is obtained and the particle size must be very small. The nature of the solvent, its volatility, and the concentration of the solution, all affect the latter and it is almost impossible to maintain a constant sample thickness. Fortunately variations in thickness seem to have little effect. We find the capillary definition technique is ideal. Usually one application produces a sample that is too thin, so we check the spectrum and then add further layers, until a quality spectrum is in prospect. We then co-add until an adequate signal:noise ratio is achieved.
Overloading the platen must be avoided. This can arise from using excessively concentrated solutions and/or overlarge drops of solution. Excessive loading gives rise to poor resolution, baseline shifting and band shape distortion (even the appearance of shoulders, band splitting, or ‘reversing’) all due to an unacceptable level of reflection and also to total absorption of the radiation within the absorption bands.
107. It is worth mentioning that there are good prototypes for the DRAFT technique in IR spectroscopy practice. One of them is the use of silicon-carbide-coated abrasive paper to grind intractable samples for subsequent DRIFT measurements, a method suggested by Sharp [29]. This approach to sample preparation turns out to be very well suited to diffuse reflectance measurements. Here a background of the silicon carbide paper is taken, and then the paper is rubbed on the surface of the material to be studied until a small amount of sample is smeared on the surface of the silicon carbide paper. The paper is then placed in a DRIFT accessory and the spectrum of the powder is measured directly.
Spectra of this kind show surprisingly little interference from the silicon carbide substrate. Even for these undiluted samples, the relative band intensities are very similar to those obtained in transmission. This can be attributed to the sample being thinly distributed. Although the measured radiation has traversed a variety of pathlengths, all of these are relatively short. As the quantity of powder on the surface is increased, the intensity of weaker bands increases more rapidly than that of the stronger bands. For sufficiently heavy deposits of powder the spectra simply resemble those obtained by placing the powder in the normal sample cup of the DRIFT accessory.
108. The abrasion technique is less successful with very soft materials and those which are torn into particles which are too large for direct measurement of diffuse reflectance. Another useful approach has been suggested by Korte and Otto [30]. These authors, when examining diffuse reflection off nonparticulate samples, have to reference their spectra against a spectrum of a diffusely reflecting standard. They found it straightforward to produce the reflectance spectrum by “diffuse reflection” off randomly oriented facets of a metallic surface. Gold coated abrasive paper (280 inch-1 grit size, 100nm gold layer) was found to be both appropriate and convenient [31].
Fig.3 shows two spectra of another diacetylenic monomer, 5,7,dodecadiyne-1,12-bis-(butyloxymethylurethane), so called 4-BCMU, recorded in transmission by the normal KBr disk technique (a) and with the aid of the DRAFT technique (b).
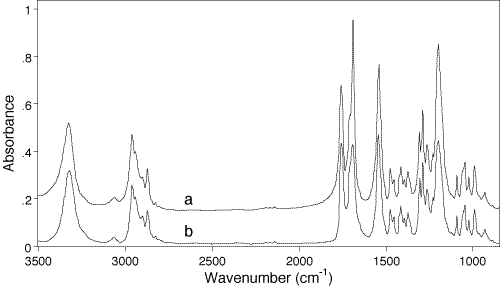
Figure 3: Transmission (a) and DRAFT spectra of 4-BCMU monomer. The last spectrum has been aquired using the Spectra-Tech DRIFT accessory, “The Collector”, and DTGS detector. The sample of 4-BCMU monomer was applied on the metal paten from 5% solution in acetone using a glass capillary. The first spectrum is shifted 0.2 a.u. upward for clarity.
109. Again it could be seen that the two spectra are qualitatively identical, and the one obtained by DRAFT is perfectly acceptable for identification purposes. The main difference between the two spectra concerns bandshape changes and intensity redistribution of the three most prominent absorptions in the 1800-1500cm-1 region. In 4-BCMU these belong to the carbonyl amide-I and amide-II moieties, i.e. to the molecular fragments which are particularly sensitive to the crystal packing of the monomer units in the lattice and consequently for the solid-state topochemical polymerizability of diacetylenic monomers [32]. The same moieties are specifically responsible also for molecular structure related electronic, nonlinear optical and mechanical properties of the corresponding poly(diacetylenes).
In reflection, intensity reduction often occurs in the most prominent bands and is explained by an ‘anomalous dispersion’ effect. Strictly, specular (or Fresnel) reflection at the front surface of a sample takes place during all spectra recording in any type of optical geometry. It is of importance, however, that unlike transmission measurements, where specularly reflected light never hits the detector, during a reflection measurement the reflected light can reach the detector.
Consequently, in a reflection experiment the detector of the instrument receives at some wavelengths additional portions of energy that have not suffered absorption, and will sum these with the light attenuated by the “constructive” absorption. In other words, a redistribution of band intensities seems to be inevitable in reflectance spectra compared to the transmittance ones.
110. To further illustrate the usefulness of the technique, Fig.4 shows two DRAFT spectra of another diacetylenic monomer, octadecadiynediol. The sample was applied as a drop of 5% solution in dimethyl ether using a glass capillary. Both spectra were recorded using the Perkin-Elmer accessory and the DTGS detector. This substance is a low melting and sparingly crystallizable solid. Spectrum a had been recorded after apparent dimethyl ether evaporation, leaving the sample as a viscous oil on the surface of the metal platen. Spectrum b had been recorded for the same sample after spontaneous crystallization of the oil deposit had finished. The clearly visible differences between the two spectra (OH-stretch region 3500-3200 cm-1, methylene chains deformation 1500-1200 cm-1, and OH-deformation 1100-900 cm-1) are characteristic for the crystallization process of this substance.
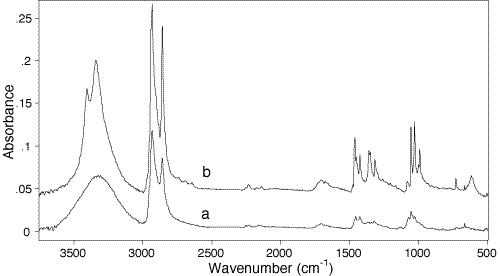
Figure 4: DRAFT Spectra of octadeca-7,9-diyne-1,18-diol monomer. (a) Spectrum of an oil residue left on the sample holder just after solvent (diethyl ether) evaporation. (b) – Spectrum of the same sample after complete in situ crystallisation. The spectrum b is shifted upward along the ordinate for clarity.
111. When materials change from the liquid phase to the crystalline one, their vibrational spectrum changes profoundly. The reasons are well understood – the vibrations of a molecule in a random moving matrix (a liquid) are simpler than those of a molecule lying in a regular lattice of molecules similar to itself.* Two effects are typical of the Raman and infrared spectra, crystal spectra are more complex and the bands sharper than they are in the melt or in solution.
*Editor’s note: We will cover this subject in future editions.
112.The spectra in Fig.6 are an excellent example. At first glance the spectrum of the oil seems weaker than its crystalline counterpart. This may be so, but it must be remembered that the bands in spectrum a are broader than in b and only the area under the bands is a true indication of intensity.
Since solid films are easy to examine, an experiment of considerable practical importance in the organic semiconductor field can be carried out – the solid state polymerization of a monomer and the study of its kinetics. The polymerization can be photo- or thermally-induced with equal facility. Similarly, thermochroic or solvatochromic transitions in poly(diacetylenes) can be followed. Examples of two of these processes are to be found in Figs.5 and 6.
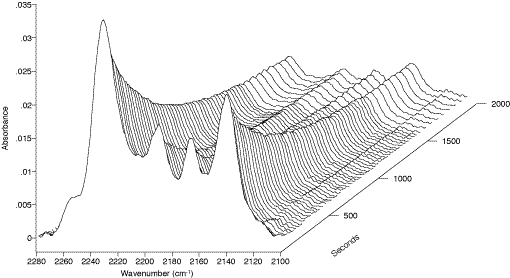
Figure 5: Kinetics of photo-induced solid-state polymerization of 4-BCMU monomer as measured by the DRAFT technique. Sample of the crystalline diacetylene monomer after recrystallisation from hexane has been applied neat on the sample holder surface and lightly crushed with a spatula. DRAFT spectra were recorded after measured intervals of UV-irradiation of the sample in situ. Total time (dose) of UV-radiation is indicated in seconds on z-axis.
113. In Fig.5 the kinetics of polymerization are followed using the weak band system near 2200cm-1 due to the C≡C stretching vibration. This mode has very low intensity in IR absorption and hence may be used advantageously in DRAFT experiments, since weak features are those least distorted by anomalous dispersion effects. Clearly, if they did arise they would ruin the quantitative evaluation of the data. In Fig.6 a thermochroic transition is followed but here weak bands in the fingerprint region are selected. Note that in each case the platen was loaded by crushing the sample onto its surface with a spatula. No solvent was involved.
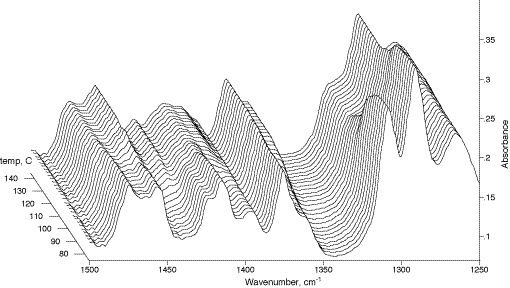
Figure 6: Kinetics of the thermochromic transition for γ-polymer of 4-BCMU. The blue poly-4-BCMU solid sample has been crushed neat on the DRAFT sample holder surface. Thermally induced structural transition was traced with the aid of a Spectra-Tech DRIFT accessory “Collector” equipped with a temperature programmer/heater. Z-axis reads the temperature of the sample in ¦C.
114. B. Liquid Samples
As already indicated above, the sampling procedure use for solutions will work for ‘oils’ or other low volatility liquids. We can easily examine stable liquid films using the DRAFT technique. A few examples of liquid spectra are shown below, with corresponding transmission spectra imported from spectral libraries. In all cases successful identification is possible with a Search routine.
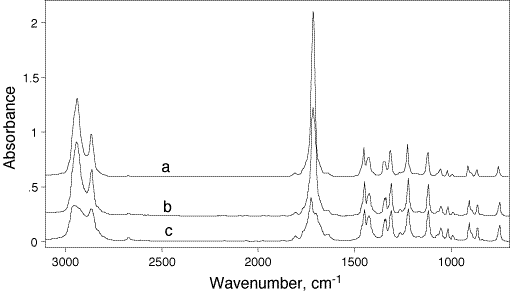
Figure 7: Comparison of transmission and DRAFT spectra of liquid cyclohexanon. (a) – Fluka library transmission spectrum of cyclohexanon; (b) – DRAFT spectrum; and (c) a “model” DRAFT spectrum of cyclohexanon recorded by using intentionally overloaded sample holder.
Fig.7 shows the Fluka library transmission (a) and DRAFT (b and c) spectra of cyclohexanone. Spectra b and c have been recorded with the aid of the “Collector” accessory and the MCT detector over several seconds, using a scan speed appropriate for the detector. Because of spontaneous evaporation of the analyte off the sample platen int he course of the DRAFT experiments, only 15 scans were co-added in cases b and c. All spectra are shown in absorbance and shifted along the ordinate for clarity. Spectrum a had been imported from Fluka library. It can be seen that spectra a and b are very similar, but that some very slight intensity redistribution is still apparent. Spectrum c, also obtained by the DRAFT technique, is shown here to illustrate that the very intense CH and carbonyl stretching bands can be severely distorted in this experiment. However, this effect is nothing more than that typical of the study in transmission of a sample that is over-thick. We will return to this point in the conclusion.
From a practical standpoint users will wish to avoid overloading the platen. Unfortunately, the ideal thickness could not be measured in our experimental arrangement. Further, it seems to vary considerably from analyte to analyte. Fortunately however it is easy to check the spectra and adjust the sample thickness and so we recommend that, as with solution evaporation, one begins a DRAFT experiment with the minimum coverage of the platen and thickens it as required.
115. Conclusion
The DRAFT technique described here cannot be described as completely novel but its demonstration, refinement and routine application are unique. Anyone possessing a diffuse reflectance accessory can use the method and as we show, it is fast and effective. Purists will argue that although the DRIFT title is appropriate to powders, it cannot strictly be applied to the experiments involving liquids because in these the reflection must be essentially specular, i.e. reflection off the front face of the liquid is combined with reflection off the surface of the platen, attenuated by double passage through the liquid – a classical case of transflectance. It is perfectly possible to use a platen which is itself roughened and hence to generate more truly DRAFT processes from liquid films. We will return to this matter in the next edition of IJVS.
116. References
1. M.P.Fuller & P.R.Griffiths, Anal Chem., 50, 1906 (1978)
2. J.A.J.Jansenm J.H.van der Maas & A.Posthuma de Boer, Macromolecules, 1991, 24, 4278-4280; J.A.J.Jansen and W.E.Haas, Polym.Commun., 1988, 29, 77
3. A.J.Michell, P.J.Nelson & C.P.Garland, Appl.Spectrosc., 1989, 43, 1482-1487; A.J.Michell, C.P.Garland & P.J.Nelson, J.Wood Chem.Technol., 9(1), 85 (1989)
4. S.R.Culler, M.T.McKenzie, L.J.Fina, H.Ishida & J.L.Koenig, Appl. Spectrosc., 1984, 38, 791
5. R.T.Graf, J.L.Koenig & H.Ishida, in Fourier Transform Characterization of Polymers, H.Ishida Ed. (Plenum, New York, 1987), p.397
6. R.T.Graf, J.L.Koenig & H.Ishida, Anal. Chem., 1984, 56, 773
7. M.T.McKenzie, S.R.Culler & J.L.Koenig, Appl.Spectrosc., 1984, 38, 786
8. P.de Donato e.a., J.Polym.Sci., B, Polym.Phys., 1992, 30 (12), 1305
9. K.C.Kole, D.Noel & J.-J.Hechler, J.Appl.Polym.Sci., 1990, 39, 1887-1902
10. K.C.Kole, D.Noel & J.-J.Hechler, Polym.Compos., 1988, 9, 395
11. see e.g., (a) Perkin Elmer Diffuse Reflectance Accessory Instructions, Rev. May 1987, Cat.No. 0993-8214; (b) Spectra-Tech. Inc., Scan Time, 1989, No.16, p.3-4
12. Spectra-Tech Inc., Product Brochure “The COLLECTOR – Diffuse Reflectance (DRIFT) Accessory, 1989, p.2
13. The influence of the nature of the metal on the quality of the spectra acquired using this optical geometry will be reported later. Stainless steel had been chosen primarily due to its chemical inertness and availability. Some experiments had been conducted using the dimensionally similar platens made from copper. These were etched with HNO3 and prepared for use according to the literature [14] to investigate a possibility of observation of the SEIRA phenomenon [15] in the modified DRIFT experiment (see text).
14. G.Xue and J.Dong, Polymer, 1992, 33, N3, 643-646
15. Y.Nishikawa, K.Fujiwara, K.Ataka & M.Osawa, Anal.Chem., 1993, 65, 556-562 (and reference therein)
16. To simplify the analysis of nonwetting liquids a pretreatment of surface of the metal platen with soap solution had been used. Treatment of the platen with cloth soaked in soap water and subsequent drying left a very thin film of soap on the metal surface. This thin film of surface active compounds remains invisible for the instrument during the subsequent optical experiment owing to the following reasons. Firstly, it would be regarded as a background and subsequently substracted from the accumulated scans. Secondly, the optical geometry used in this work, contrary to the grazing incidence reflection techniques, is practically insensitive to the very thin surface films. Thus, in the worst event this approach could lead to the introduction of a “dirt” into the sample of liquid analyte, but it seems would not – at least during routine or identification measurements. This results in spreading of the large opaque drops of such liquids into semitransparent films, greatly simplifies analysis of nonwetting liquids, and substantially widens the scope of applicability of the modified technique. For instance, spectra of water films or water solutions of some analytes can be run.
17. The Aldrich Library of FT-IR Spectra, C.J.Pouchet, Aldrich Chemical Co.Inc., Milwaukee, WI, 1984, Vol.1 and 2, 2,900 pp
18. A/Ishitani, H.Ishida, F.Soeda & Y.Nagasawa, Anal.Chem., 1982, 54, 682-687
19. R.J.Jakobsen, “Fourier Transform Infrared Spectroscopy, Application to Chemical Systems”, J.R.Ferraro, L.J.Basile, Eds. Academic Press, New York, 1979, Vol.2, Chapter 5
20. R.J.Jakobsen, “Fourier Transform Infrared Spectroscopy, Application to Chemical Systems”, J.R.Ferraro, L.J.Basile, Eds. Academic Press, New York, 1985, Vol.4, Chapter 8
21. J.D.Swalen & J.F.Rabolt, “Fourier Transform Infrared Spectroscopy, Application to Chemical Systems”, J.R.Ferraro, L.J.Basile, Eds. Academic Press, New York, 1985, Vol.4, Chapter 7
22. M.L.E.TeVrucht and P.R.Griffiths, Appl.Spectrosc., 1989, 43, 1492-1494
23. R.K.Vincent and G.R.Hunt, Appl.Opt., 1968, 7, 53
24. P.J.Brimmer, P.R.Griffiths & N.J.Harrick, Appl.Spectrosc., 1986, 40, 258
25. P.J.Brimmer and P.R.Griffiths, Appl.Spectrosc., 41, 791 (1987)
26. D.M.Hembree, Jr., and H.R.Smyrl, Appl.Spectrosc., 43, 267 (1989)
27. B.Crawford, Jr., T.G.Goplen & D.Swanson, in Advances in Infrared and Raman Spectroscopy, R.J.H.Clark and R.E.Hester, Eds. (Heyden, London, 1980), Vol.4, p.47
28. E.B.Wilson, Ann.Rev.Phys.Chem., 30, 1 (1979)
29. J.Sharp, European Spectroscopy News, 1982, 43, 4
30. E.H.Korte and A.Otto, Appl.Spectrosc., 42, 38 (1988)
31. A.Otto, Thesis (Essen 1987); Fortschr.-Ber.VDI Reihe 8, Nr.146 (VDI-VErlag, Dusseldorf 1987)
32. R.H.Baughman and R.R.Chance, Ann.N.Y.Acad.Sci., 1978, 313, 705
33. R.G.Greenler, J.Chem.Phys., 1964, 44, 310-314
34. Allara
REF: Int. J. Vib. Spect., [www.irdg.org/ijvs] 1, 4, 95-116 (1997)
