Vibrational properties of the sol-gel prepared nanocrystalline TiO2 thin films

Y. Djaoueda*, Simona Badilescub,
P.V. Ashritb and J. Robichauda
a Université de Moncton – Campus de Shippagan,
218, boul. J.-D. Gauthier,
Shippagan, N.-B., Canada E8S 1P6
*Author to whom correspondence should be addressed
Email: djaoued [at] cus.ca
b Département de physique et d’astronomie,
Université de Moncton,
Moncton, N.-B., Canada E1A 3E9
Abstract
Nanocrystalline TiO2 films with small crystallites have been prepared by a sol-gel method followed by a hot-water treatment in the presence of polyethylene glycol (PEG). The XRD results show that the samples are in the form of anatase and that the average particle diameter of the nanocrystals is 4.5 ± 0.5 nm. In addition to the anatase features, the Raman spectra
(bands at 249, 323, 366 and 407 cm-1) revealed the presence of small amounts of brookite. The main Raman band of the anatase appears to be broadened (FWHM of 21 to 24 cm-1 compared to 7 cm-1 for the bulk anatase) and shifted to higher frequencies (150 to 152 cm-1 compared to 144 cm-1). To account for these large shifts and broadening, the dimensional contribution has to be considered as well as the nonstoichiometry of the material. Micrometric line scanning and bidimensional mapping (40 x 40 m m area) of TiO2 films heated up to 800°C shows the presence of both the anatase and rutile phases. FTIR spectra of the films treated in hot water for short periods show that the bands characteristic for PEG disappeared, confirming the dissolution of the polymer in water. In the low-frequency region, the bands appear broadened probably due to the presence of an amorphous material. The bands are better defined in the spectra of the heat-treated films. The transverse optical phonon frequencies of anatase (436 cm-1) and rutile (490 cm-1) have been identified in the infrared spectra of the heat-treated films.
Introduction
The nanostructured materials made up of grains or clusters in the nanometric range exhibit new optical properties of interest in many areas of application such as electroluminescent devices, chromogenics, optical and chemical sensors, modulators and display devices. For example, the thin films of TiO2 formed of nanosized particles in the anatase form show a very high efficiency photocatalytic activity due to their large internal surface [1]. Both the optical properties and the photocatalytic activity of TiO2 coatings depend strongly on the phase, the crystallite size and the porosity of the coatings. We have prepared nanocrystalline TiO2 by a complexing agent-assisted sol-gel route and have studied the structure and the spectroscopic properties of thin films deposited by dip-coating. The average size of the nanocrystals was found, by XRD and Raman spectroscopy, to be in the range of 10-80 nm [2].
The nanocrystalline systems are interesting, not only because of their applications, but also from a fundamental point of view because of the changes in their electronic and vibrational properties. Indeed, the small physical dimensions of the crystals in nanomaterials (grain diameter smaller than radiation wavelength), lead to a shift and broadening of the first-order Raman peaks. These changes in the band shape and position are related to the breaking of the translational symmetry of the crystal (the phonons, i.e. lattice vibrations, are confined in space, their plane wave character is lost) due to structure defects such as grain boundaries. Due to the lack of long-range order in nanocrystals, the phonon momentum selection rule, true in ordered systems, is no longer valid. By the use of an adequate model, the effect of the phonon confinement on the Raman spectra permits an estimate of the average size of nanocrystals [2, 3].
Micro-Raman spectroscopy is a powerful and versatile tool for the analysis of solid films. It allows the identification of different localized microscopic regions, with a high spatial resolution and provides structural information on the material at the scale of a few lattice constants.
The infrared spectrum of crystalline solids, for a particle size smaller than the radiation wavelength, should be independent on the particle size. However, due to polarization effects (charge induced by the external EM field), the particle shape and the state of aggregation may have a strong effect on the vibrational modes which have a translational character [4]. The infrared active phonon frequencies of titania nanoparticles with controlled size and shape prepared by a sol-gel method have been recently measured by Gonzalez [5, 6]. The authors found a good agreement between the positions of the phonon bands measured under various conditions and those calculated by using a generalized effective medium approximation. However, the experiments were limited to polycrystalline materials with particle sizes that ranged from 80 to 300 nm.
To reduce the size of nanocrystals and increase the porosity, Vong et al. [7] used a polymer modified sol-gel method. The decomposition and the elimination of the polymer with different molecular weights (of polyethylene glycol, PEG) during the relatively high temperature treatment is reported to allow the formation of films with suitably designed porosity. Recently, Matsuda et al. [1,8] have prepared nanocrystalline anatase embedded in an amorphous SiO2 matrix at low temperature by using a hot-water treatment. The authors emphasize the role of PEG in the evolution of the nanostructure, i.e. the formation of anatase crystallites and nanosized pores in the films.
The aim of the present work is to prepare sterically stabilized titania thin films with very small nanocrystallites (< 10 nm) by using a hot-water treatment and to study the vibrational properties of these films by micro-Raman and FTIR spectroscopy. We have also investigated the crystallisation and the phase transition in titania thin films. The densification and crystallization of titania coatings at a low temperature is important for the fabrication of transparent films on substrates that can not withstand the high temperature treatments required by some of the polymers and other substances.
Experimental
Figure 1 shows the flow chart of the preparation procedure we have followed to achieve the polyethylene glycol (PEG)-containing TiO2 films. For the preparation of these coatings, solutions that contained 4 wt% TiO2 were prepared by using titanium tetra-n-butoxide (TTB) obtained from Aldrich Chem. Co. as the starting material. Titanium tetra-n-butoxide was first mixed with a small amount of ethanol (EtOH) in a container and stirred for 30 min. A mixture of water that contained 3 wt% HCl and ethanol was poured under stirring into the transparent solution to promote hydrolysis; the molar ratio of H2O to TTB was 4:1. Finally, an organic polymer (PEG) was added slowly to this solution and stirred for one hour, and the resultant solution was used for the TiO2 film coating. The average molecular weight of the PEG used in this preparation was 600. The molar ratio of PEG to TiO2 was varied in the range between 0.15 and 1.2. Most of the results presented here pertain to the TiO2 films prepared from a solution in which the PEG to TiO2 molar ratio was 1.0.
Figure 1. Flow chart for the method of preparation and hydrothermal treatment of TiO2 films.
TiO2 films were dip-coated on different substrates from the above said solution. The substrates (Corning glass, silicon wafers) were carefully cleaned, first with detergent solution in an ultrasound bath. After a thorough rinsing in running water, the ultrasound bath treatment was repeated with distilled water. This was followed by a thorough rinsing of the substrates in acetone and isopropanol. Then substrates were dried using a hot air blower. Before the deposition, the substrates were heated at 400°C for an hour and cooled. A computer controlled dip-coating apparatus built in our laboratory was used for the deposition of the TiO2 films. The substrates to be coated with the TiO2 film were lowered into the coating solution and then withdrawn at speeds ranging between 0.1 and 4 mm/s. The films were then dried at 80°C for 30 min in air using an oven. These samples were then immersed in boiling water at a temperature of 100°C for periods varying from 15 to 180 min. In order to study the crystallisation and the phase transition in titania thin films, the films were also heat-treated at different temperatures ranging between 100 to 900°C for an hour.
X-ray crystallographic studies of the TiO2 films were carried out. A spectrometer equipped with graphite monochromator and analyzer crystals, and Cu-Ka radiation was used for this purpose. The signal from the thin film was enhanced over the signal from the quartz substrate by keeping the angle of the incident X-ray beam fixed at 2°. Each distinguishable X-ray reflection was fitted to a gaussian profile to determine its center, and a least-squares fit of the set of reflection angles from a crystalline phase was used to determine the lattice constants. An offset in the scattering angle theta was allowed as an adjustable parameter to increase the precision of the lattice constant determination. The Raman spectra were taken at room temperature with a Jobin-Yvon Labram micro-Raman apparatus equipped with a motorized xy stage and autofocus, using the 632.8 nm line of a He-Ne laser as excitation. The laser power was kept low in order to avoid undesired heating effects on the samples. The spectral resolution of this apparatus is estimated to be around 3 cm-1. For the IR measurements, TiO2 films deposited on silicon wafer substrates and treated under the same conditions as the films deposited on glass substrates were used.
The IR spectra of the dip coated TiO2 samples on silicon wafers were recorded by a Mattson FTIR spectrometer.
Result & Discussion
In Figure 2 are shown the glancing incidence X-ray diffraction (XRD) patterns of the TiO2 films prepared with a solution of TiO2 to PEG ratio of 1, and immersed in boiling water at a temperature of 100oC for periods varying from 15 to 180 min. The data are plotted as a function of the scattering vector, q = (4p /l ) sin q . These XRD patterns are given in the figure along with the peaks reported in the literature for anatase and brookite [9]. The lattice constants for the hydrothermally treated films were compared to the bulk lattice constants given by JCPDS card 21-1272 for TiO2. From these results we can conclude that most of the TiO2 samples studied here are in the form of anatase. Further, the diffraction peaks are much broader than the instrument resolution, which indicates small crystal sizes. The crystal size can be determined from the integral width of the diffraction peaks[10]. The resolution of the diffractometer corresponds to an integral width of 0.32 nm-1. The anatase peaks at 17.5 and 33.0 of the TiO2 sample treated at 100°C in water for 3 hours were fitted to Gaussian line profiles. Based on these fits, the integral widths of the peak, corrected for the instrument resolution, are Dq = 1.57 nm-1 and 1.29 nm-1, respectively. The Scherrer formula, expressed in terms of q, is Dq * Dx = 2p , where Dx is the average particle diameter. The measured peak widths correspond to an average particle diameter of (4.5 ± 0.5) nm.
Figure 2. XRD patterns of TiO2 films after the hydrothermal treatment (PEG:TiO2=1, the duration of the treatment is given for each pattern)
Raman spectra of the TiO2 samples prepared from solutions with varying molar ratios of TiO2 to PEG and treated at 100°C in hot water are shown in Figure 3. In all the spectra the Raman features of the anatase are present [11]: the anatase main band is very broadened and high-frequency shifted with respect the values typical of the bulk crystal[12], displaying the main aspect of the nanocrystalline titania [13]. A detailed Raman spectrum corresponding to the TiO2 film obtained from a solution of TiO2 to PEG molar ratio of 1 is shown in Figure 4. It is seen from this figure that, in addition to the anatase features observed earlier (Figure 3), some weak peaks at 249, 323, 366 and 407 cm-1 are also observed, revealing the presence of a small amount of brookite [14]. The XRD results seem to be in accordance with the Raman data. However, unlike the Raman spectra, the XRD results do not seem to show peaks corresponding to brookite. This may be mainly due to the effect of bulk of the x-ray signal originating from the substrate and to some extent also due to the fair amount of overlap between the anatase and brookite peak positions. Taking into account these factors it is estimated that the contribution of brookite phase to the XRD pattern would not exceed 5 %.
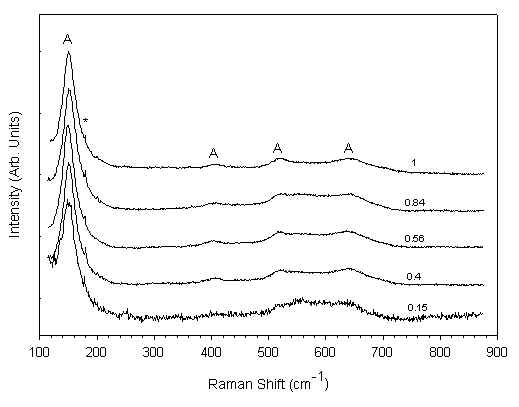
Figure 3. Raman spectra of TiO2 films prepared with different amounts of PEG and treated at 100°C for 1 hour.
(the molar ratios of PEG:TiO2 are shown along for each spectrum)
Figure 4. Details of the Raman spectrum of TiO2 film obtained from a solution with a molar ratio of PEG:TiO2 = 1 and treated at 100°C for 1 hour. (B = brookite).
Only small differences are observed between the various spectra shown in Figure 3. This indicates that there is no systematic dependence of the film characteristics on TiO2 to PEG molar ratios of the solutions from which these films are obtained. The broadening and high-frequency shift of the main Raman band of the anatase phase maybe due to a dimensional effect such as the phonon confinement [3]. The value of the FWHM of the main Raman band of the anatase ranges in our films from 21 to 24 cm-1 (the bulk value being 7 cm-1), while their peak frequency varies from 150 to 152 cm-1 (144 cm-1 being the bulk value). However, the phonon confinement model cannot explain such large shifts and broadening, even by taking into account the effect of the presence of a brookite Raman band at 152 cm-1. We must also consider the other phenomena that may affect the vibrational spectra, namely, the non-stoichiometry, which may have a large contribution and which is often present in sol-gel derived nanocrystalline systems. The presence of O vacancies is known to produce a significant broadening and high-frequency shift of the main anatase band [15]. The separation of the dimensional and non-stoichiometry contributions is rather difficult and would require further detailed investigations. Another phenomenon usually present in nanocrystalline systems is the hydrostatic pressure acting on the nano-grains. While this mechanism may also be responsible for a band-shift [16], it cannot explain the large band broadening seen above and, hence, it does not seem to play a very important role in these samples.
Figure 5 shows the Raman spectra of TiO2 films annealed at temperatures between 400°C and 800°C. Only the typical features of anatase are present in the spectra until the film reaches 800°C. At this temperature, a mixed anatase-rutile phase is seen, while the pure rutile phase is obtained only at 900°C.
Figure 5. Raman spectra of of TiO2 films heat-treated in a dry atmosphere from 400°C to 800°C (A = anatase and R = rutile) (The peaks of the plasma line are marked by an asterisk)
In order to evaluate the homogeneity of the films, especially in the samples where anatase and rutile coexist, we have performed micrometric line scanning and bidimensional mapping. The mapping was obtained using the motorized xy stage, with steps of several micrometers. We used two different methods to evaluate the relative amounts of rutile and anatase. In the first, we did several measurements on pure anatase and pure rutile films under the same experimental conditions in order to obtain the reference spectra. From these spectra, we calculated the anatase to rutile intensity ratio of the whole spectra and of the various anatase and rutile bands. The calibration was carried out at different laser powers, in order to rule out any dependence of the intensity on the heating. Then, for every map point, we calculated the intensity ratio of different pairs of anatase and rutile bands. Normalizing the ratios by using the reference spectra, we obtained the map of the relative anatase to rutile amounts. The results obtained by using different pairs of peaks are in good agreement. In Figure 6 is shown the map of a 40 x 40 micrometer area, displaying the relative anatase to rutile concentration obtained by the normalized ratio of the 515 cm-1 anatase band and the 447 cm-1 band of rutile. Small variations of the relative amounts (from 0.8 to 1.2) are observed on the considered area. An identical behaviour, but with more pronounced variations (from 0.8 to 1.7), is obtained using the 143-anatase /612-rutile peaks ratio.
Figure 6. A 40 x 40 micrometer area Raman map showing the anatase to rutile ratio in films prepared with PEG and heated to 800°C
The second method uses a software deconvolution procedure that requires the single components spectra (models) and returns the percentages of the different models present in each spectrum taken at different points on the map. In that case, it is necessary to include also the spectrum of the substrate in order to have more accurate results. However, due to some problems in the deconvolution routine, these results were not useful.
Figure 7 shows the infrared absorption spectrum of the PEG-containing TiO2 films ( the molar ratio of PEG: TiO2 of 1), before the hot-water treatment (Figure 7a ), along with those of the film treated in hot water for different durations. The spectrum of the non-treated film shows the presence of OH groups ( nOH at 3478 cm-1, dOH at 1644 cm-1), that probably belong to Ti-OH bonds as well as to the absorbed water. The bands at 2870, 1459 and 1350 cm-1 correspond to the C-H vibrations, while the strong bands centered at 1248 and 1116 cm-1 originate in the C-O-C bonds of PEG, respectively. The pattern of the spectrum changes entirely (Figure 7b) when the film is immersed in boiling water even for a period as short as 5 min. The bands corresponding to PEG disappeared with the hot water treatment indicating that the PEG molecules leach out of the film. Increasing the duration of the treatment lead to a shift of the band in the Ti-O stretching region to lower frequencies. For comparison, in Figure 8 are given the spectra of TiO2films heat treated at different temperatures in a dry atmosphere. In the low-frequency region of the spectrum, corresponding to the 400°C treated film (Figure 8c), the TO phonon band appears at 436 cm-1. This is in agreement with Gonzalez et al. data on the TO phonon modes of the nanocrystalline titania [5, 6]. When the same film was heated to 8000C (Figure 8f), in addition to the 435 cm-1 band, a new band developed at 490 cm-1. This band may correspond to the TP phonon frequency of TiO2 in the rutile phase . The Raman spectra of the film heated to 800°C, confirm the presence of a mixed anatase-rutile phase.
Figure 7. FTIR spectra of TiO2 films, obtained from a solution with a molar ratio of PEG:TiO2 = 1, after the hydrothermal treatment
(the duration of the treatment is given for each spectrum)
Figure 8. FTIR spectra of TiO2 films heat-treated in a dry atmosphere, the duration of the treatment is given for each spectrum (Si bands are marked by an asterisk)
The FTIR results are in agreement with the XRD and Raman data confirming the presence of the anatase phase in the hot water treated film. Due to the small average size of the crystallites in the hot water treated film (around 5nm), the band is shifted to a lower frequency.
Conclusion
The preparation of titanium dioxide (TiO2) films formed of anatase nanocrystallites has been carried out with a low temperature method. The maximum process temperature in this method is around 100°C which allows the utilization of heat sensitive substrates. To obtain highly porous and nanocrystalline TiO2 films a PEG modified sol-gel method followed by a hot water treatment has been used. The structural, X-ray and Raman studies carried out on these films show that the films are formed predominantly of anatase crystallites with dimensions of the order of 5nm. Raman results also indicate the formation to a very small extent (<5%) of the brookite phase. The infrared spectra show in the low-frequency region the presence of TO phonon bands. The characteristics of such films are also found to depend on the duration of the thermal treatment.
Acknowledgements
The financial support of Faculté des études supérieures et de la recherché (FESR) of Université de Moncton in carrying out this work is gratefully acknowledged.
References
- A. Matsuda, Y. Kotani, T. Kogure, M. Tatsumisago, and T. Minami, J.Am. Ceram. Soc., 83(1) 229 (2000).
- Y. Djaoued; S. Badilescu; P. V. Ashrit; D. Bersani; P.P. Lottici, and J. Robichaud. In Raman Spectroscopy and Light Scattering Technologies in Materials Science, Ed. D. L. Andrews, SPIE, 4469 70 (2001)
- D. Bersani, P. P. Lottici, Xing-Zhao Ding, Appl. Phys. Lett., 72 (1) 73 (1998)
- M. Ocana, V. Fornes, J.V. Serna, J. Solid State Chem., 75 364 (1988).
- A. G. Gaynor, R. J. Gonzalez, R. M. Davis, R. Zallen, J. Matter. Res., 12, 1755 (1997)
- R. J. Gonzalez, Ph. D. Dissertation, Virginia Polytechnic Institute, 1996.
- M.S.W. Vong, N. Bazin and P.A. Sermon, J.Sol-Gel Sci.and Tech.,8, 499 (1997).
- A. Matsuda, S. Katayarna, T. Tsuno, N. Tohge, and T. Minami, J. Am. Ceram. Soc., 75(8), 2217 (1990).
- Card numbers 21-1272 (anatase) and 29-1360 (brookite). Joint committee on Powder Diffraction Standards, American Society for the Testing and Materials, « Powder diffraction file », (Swathmore, Pa 1986).
- E. Bertaut, in International Tables for x-ray Crystallography, Vol. 3, p. 318 (Kynoch Press, Birmingham 1968).
- P.P. Lottici, D. Bersani, M. Braghini, and A. Montenero, J. Mater. Sci., 28, 177 (1993).
- U. Balachandran, N.G. Eror, J. Solid State Chem., 42, 276 (1982).
- D. Bersani, G. Antonioli, P.P. Lottici, T. Lopez, J. Non-Cryst. Solids, 232-234, 175 (1998).
- G.A. Tompsett, G.A. Bowmaker, R.P. Cooney, J.B Metson, K.A. Rodgers, and J.M. Seakins, J. Raman Spectrosc., 26, 57 (1995).
- J.C. Parker and R.W. Siegel, J. Mater. Res., 5, 1246 (1990).
- Y.S. Bobovich and M.Y. Tsener , Opt. Spectrosc. 53, 332 (1982).
Received 10th December 2001, accepted 20th December 2001.
REF: Y. Djaoued, Simona Badilescu, P.V. Ashrit & J. Robichaud Int. J. Vib. Spect., [www.irdg.org/ijvs] 5, 6, 4 (2001)