TGFTIR
MANUFACTURERS ANNOUNCEMENTS

Tracking Down a Powder Coating Based on PUR
![]()
Elisabeth Kapsch* and Albrecht Rager**
*NETZSCH-Gerätebau GmbH
**BRUKER Optik GmbH
Introduction
Powder coatings are increasingly employed in the automotive industry. They meet ecological requirements to release the least possible pollution during curing. Prior to using them, it should be guaranteed that they have a homogeneous gleaming laquer coating depending on particle-size and distribution and the powder distribution on the surface.
DSC and Reaction Kinetics
DSC (Differential Scanning Calorimetry) measurements offer a fast and accurate description of a reaction system. The exothermal curing reaction of a powder coating based on PUR is influenced by the heating rate (Figure.1 ).
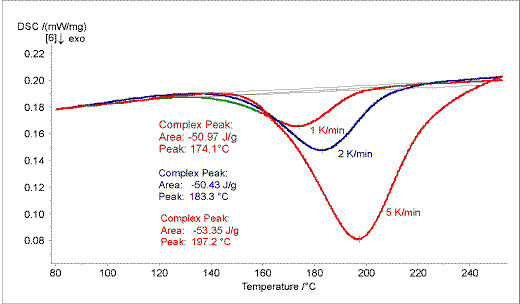
Figure 1. The curing of the powder coating was monitored at three heating rates: 1, 2, 5 K/min. The exothermal curing is influenced by the heating rate.
With increasing heating rates the peak positions shift to higher temperature while the peak areas nearly remain constant.
For a reaction kinetic evaluation of the DSC measurements, the thermoanalytical data at different heating rates are integrated in the software program THERMOKINETICS. Besides a model-free estimation of the activation energy, analysis of multiple-step reactions is possible. The curve fitting is obtained by using non-linear regression (Figure. 2).
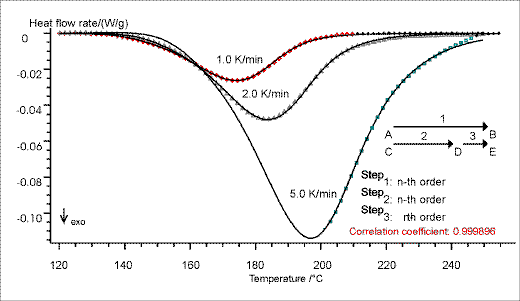
Figure 2. Due to the analysis of multiple-step reactions by non-linear regression a very good fitting of the three-step reaction model is achieved for all three DSC measurements. This fitting allows reliable predictions.
Engineering graphics allow predictions on the isothermal behaviour of the powder coating investigated by non-linear regression (Figure. 3).
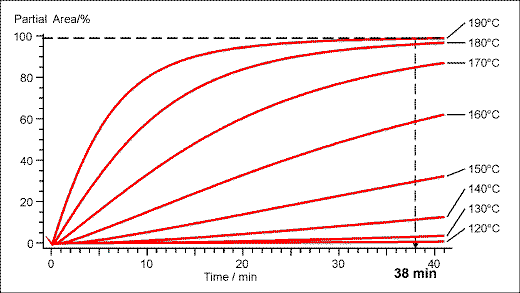
Figure 3. Isothermal plot of the partial area versus time for the curing reaction. Predictions can be made for any temperature
TG-FTIR
Simultaneous TG-FTIR (Thermogravimetry – Fourier Transform Infrared Spectroscopy) measurements deliver additional information as to the curing reaction, temperature stability and decomposition behavior.
A quantitative (TG) and qualitative characterization (FT-IR) of the evolved gases can be obtained with a single measurement on one and the same sample under identical conditions.
Thermogravimetry (TG) is a well established method for the investigation of organic substances. It follows mass changes as a function of time and/or temperature and gives information about characteristic decomposition temperatures and quantitative composition (e.g. softener content) of the investigated material [DIN 51006].
An identification of gases released directly from the sample or during thermal treatment cannot be performed just by thermal analysis.
Infrared spectroscopy (IR) is an especially widespread method [1, 2] in the fields of polymers and organic chemistry. It gives, with the exception of homonuclear diatomics and noble gases, a characteristic spectrum for each substance. The FT-technique adds the sensitivity and speed to accurately follow rapid decomposition steps. Due to the small molecular interaction in the gas phase, gas mixtures can be resolved into their single components by subtracting away library spectra of the corresponding pure compounds. Digital libraries are available, considerably simplifying identification of the evolved gases [3].
Combined with thermogravimetry, IR-spectroscopy gives exact information about which substances are formed at which temperature (on-line analysis). Thus, the TG-FTIR coupling (method) gives a deep insight into the course of decomposition reactions and yields information about the physical-chemical nature of the observed process.
Experimental
The investigation of the powder coating based on PUR was carried out with the Thermo-Micro-Balance TG 209 (Netzsch) coupled to an FT-IR spectrometer Vector 22 (Bruker). The thermo balance and FT-IR spectrometer are connected via a heated transfer line (230°C), adjusted to both systems (Figure. 4). The transfer line opens in a heated (230°C) gas cell with optimized volume/path length ratio. On account of the small volume in the thermo micro balance, transfer line and gas cell, a very low transfer gas flow can be used.
This guarantees a high concentration of the released gases, transported in the gas cell, and thus a maximum sensitivity.
The measurement was carried out in a nitrogen atmosphere at a gas flow of 10 ml/min. Because of the vacuum-tight construction of the thermo micro balance and the gas cell, both systems can be evacuated together prior to the measurement in order to minimize the influence of residual gases (e.g. oxygen) on the pyrolytic decomposition. The measurements were conducted from room temperature to 500°C at a heating rate of 5 K/min. The transfer line and gas cell were adjusted to 200°C. For the simultaneous FT-IR measurement, a resolution of 4 cm-1, in the spectral range 650 – 5000 cm-1 at a time resolution of approx. 15 sec, was selected. Electronic triggering of both analysis procedures enables the same start and end temperature. Therefore, an exact correspondence of the gases identified by IR spectroscopy to the decomposition temperature measured thermogravimetrically is possible.
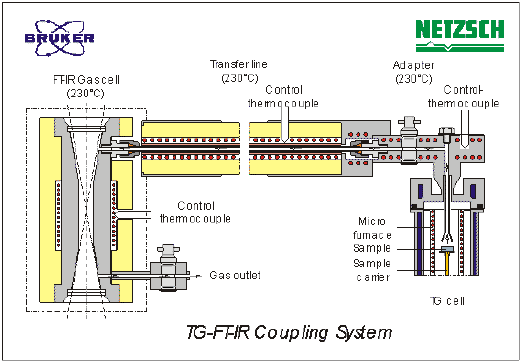
Figure 4. The TG-FTIR coupling system designed by Netzsch and Bruker
The TG measurement of the powder coating based on PUR depicts Figure 5. Before the two-step decomposition at 353°C and 411°C two small masses losses can be observed at the maximum decomposition rate temperatures (DTG peaks) at 85°C and 203°C. These two masses losses amount to 1 % and correlate with the curing reaction of the material (see Figure 1 and 2).
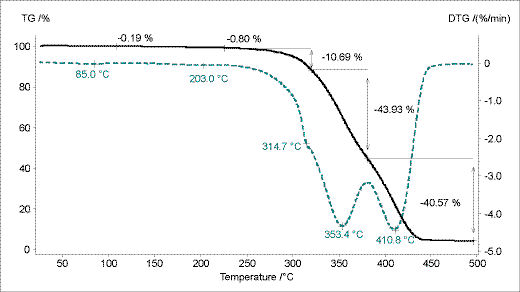
Figure 5. TG measurement curve of the powder coating based on PUR.
Single FT-IR spectra were taken at the maximum decomposition rate temperatures (DTG peaks) for evaluation of the evolved gases. The single FT-IR spectra at 85°C already indicate small emissions of methacrylic acid (see Figure 6). The emissions correspond to a mass loss of 0.2 %. At 203 °C carbon dioxide and an isocyanic acid can be clearly identified by a library search (Figure. 7).
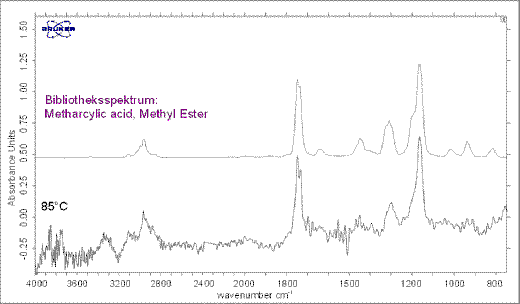
Figure 6. Measured spectrum at 85°C. Emissions of a methacrylic acid can be detected.
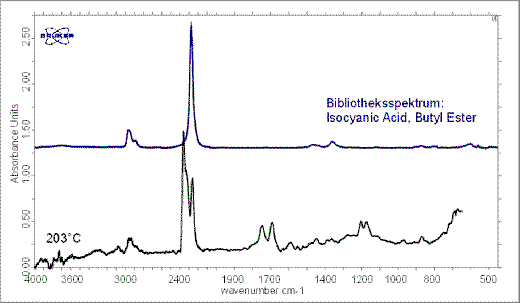
Figure 7. Single spectrum at 203°C. Isocyanic acid occurs during the curing reaction.
The FT-IR spectrum at 315°C indicates methacrylic acid and still sub-ordinated isocyanic acid (Figure 8). At 353°C is gas phase mainly consists of methacrylic acid and maximum emissions of methanol can be detected (Figure 9).
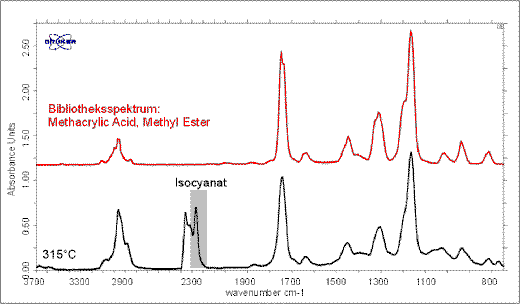
Figure 8. At 315°C isocyanic acid can be still detected. The released gases are mainly due to methacrylic acid.
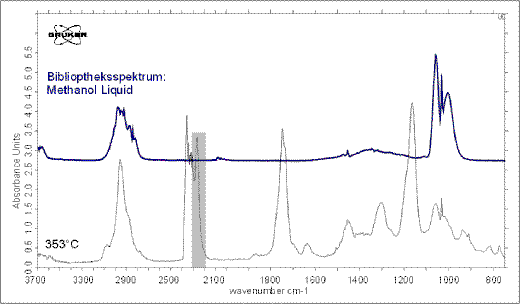
Figure 9. At 353°C methanol occurs in the gas phase. Isocyanic acid and methacrylic acid are still present.
The calculated FT-IR traces of methacrylic acid and isocyanic acid correlate with the first small mass losses (DTG peaks at 85°C and 203°C; Figure. 10). The release of methacrylic acid cannot be observed in the DSC curve. Isocyanic acid is released during the exothermal curing reaction.
The release of isocyanic acid is finished after the first main mass-loss step (Figure 11). Methacrylic acid evolves during the two-step decomposition of the powder coating and is accompanied by the release of carbon dioxide. The decomposition product methanol is detected between the 300°C and 430°C.

Figure 10. TG, DTG and DSC curve in comparison with the traces of the detected methacrylic and isocyanic acid.

Figure 11. Correlation of the FTIR traces and the TG curve of the powder coating based on PUR.
Summary
The DSC method allows the description of powder coating systems. The glass transition and the exothermal curing reaction as well as the degree of cross-linking can be determined. Kinetic analysis allows the determination of the reaction model. Reliable predictions of the curing behavior can be taken from engineering graphics.
TG-FTIR coupling monitors the thermogravimetrical behavior and identifies the evolved gases during curing. Both results correlate, this means the released gases can be referred to the mass loss.
Before the curing of the here investigated powder coating a release of methacrylic acid can be clearly detected. During the polyaddition reaction isocyanic acid evolves. This indicates encapsulated molecules or a steric hindering of the isocyanic acid which cannot take part on the reaction.
References
- GRIFFITH. P.R., DE HASETH, J.A.: Fourier Transform Infrared Spectroscopy, 1st Edition, Willey & Sons, New York, 1983
- GÜNZLER, H.: IR-Spektroskopie: Eine Einführung, 3. Aufl. VCH, Weinheim, 1996
- Titel story: TG+FTIR, mehr als nur die Summe der Systeme, GIT Laborfachzeitschrift, 8, 806 – 807, (1998)
- RAGER, A., TRESER, E.: TG-FTIR: One System, Twice the Power, 4th Symposium and Workshops on Pharmacy and Thermal Analysis, Karlsruhe (1999)
Contacts
| NETZSCH-Gerätebau GmbH Wittelbacherstrasse 42, D-91500 Selb / Bavaria, Germany Phone: +49-9287-881 0 Fax: +49-9287-881 44 e-mail: at [at] ngb.netzsch.com e-mail: e.kapsch [at] ngb.netzsch.com |
BRUKER OPTIK GmbH Rudolf-Planck-Strasse 23 D-76275 Ettlingen Phone: +49-7243-504-651 Fax: +49-7243-504-698 e-mail: albrecht.rager [at] bruker.de |

