Spectrum One Announcement

8. IMPORTANT NOTE
Back in early October, Perkin Elmer invited me to attend the Marketing Launch of a new FTIR – their Spectrum One instrument. I donned my ‘press’ badge and brandishing notebook and pencil, noted down everything I could find. I have produced the article to follow – it is my personal view of the instrument. – Remember it is not a description authorized by the company. I asked the company’s scientists for details where my notes were inadequate and once written, I asked P-E to check the manuscript for glaring errors, but I DID NOT invite them to edit the paper.
I have also started work on a technical article on Spectrum One for you. Since the company allowed me access to “everything”, its preparation is a bit of a mammoth task, so don’t expect the see the second part for a few editions yet.
Patrick Hendra
Editor
Perkin Elmer’s New Instrument
– Spectrum One
Your Editor’s Totally Prejudiced description
Immediate reaction – small, neat and looks smart. Totally computer controlled with no equivalent of the built-in control panel found on the PE1600 and Paragons and the machine comes with several accessory pods. The Nicolet Avator but coloured P-E grey, I hear you ask? No I don’t think it is. I think it’s significantly different. The specification looks excellent and quite clearly the machine would be useful in a research laboratory.
Next reaction – has several clever features. Not features aimed at me – an old spectroscopist, but rather at the young chemist or materials student and occasional user or the QC analyst. One feature I really like is a touch screen set up to make spectroscopy absolutely idiot proof.
But then let me tell you about it
Basic Layout
Spectrum One is set out in the now contemporary way – a very small footprint on the bench with a full-size sample area symmetrically situated in the front. It’s about a foot high (300mm) and has a depth and width of around 2 ft sq., so it’s area even allowing for the cables at the back is considerably less than a square metre. It weighs around 30kg (60lbs), not light but unlikely to bend the bench top. A computer controls the instrument, but this doesn’t have to be adjacent to the optical bench. The computer can be in a separate room or even miles away.
The sample area (and let’s face it, this is the bit the user actually wants to know about) in it’s transmission form, has a horizontal plate onto which is mounted the industry standard 2″ x 3″ slideway stand and the whole lot is closed by a detachable lid.
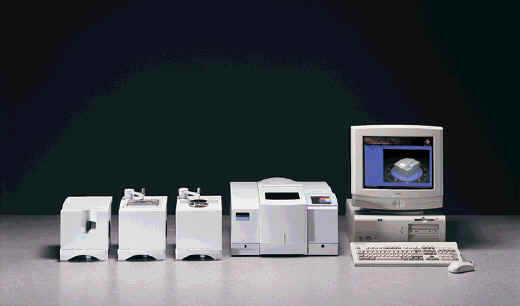
Figure 1. The Spectrum One system
(left to right: diffuse reflection accessory, Horizontal ATR, universal ATR, the optical bench fitted with the transmission accessory pod and of course, the computer.)
To the right of the sample area, you will see a rectangular panel. In strip-down trim this acts as a simple status indicator with diodes to tell you that the source and laser are working and whether the interferometer is scanning or not.
In it’s higher specification, Spectrum One has a clever touch sensitive liquid crystal display in this position. The touch screen enables occasional and non-expert users to use a custom-made procedure especially prepared for them and to do so with minimal skill.
Figure 2. The Spectrum One Built-in touch screen – two examples
In Figure 2, you will see the touch screen set up to carry out a horizontal ATR based routine. Once called up, the screen requires the user to insert the appropriate accessory. Pressing the touch screen takes the user through all the essential steps – checking the accessory, insertion of the sample, optimization of the system, recording the spectrum and its presentation in an agreed format on the computer screen, and if required on paper through a printer. This feature seems to me to be ideal for use in teaching, in service laboratories and of course, in routine analysis. In the past, instrument makers have tended to produce instruments that require the user to understand how the system and accessories work. However, highly expert chemists or pharmacists, materials scientists or skilled analysts want to use the instruments and interpret the results. Their cross-section of skills do not include experimental spectroscopy so the approach adopted in Spectrum One is timely and highly appropriate.
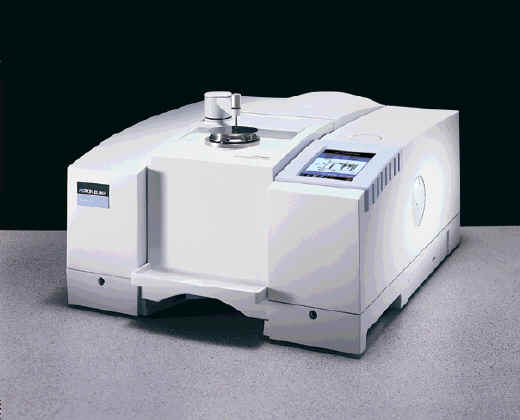
Figure 3. Spectrum One fitted with it’s universal ATR after a spectrum has been recorded. A small spectrum can be seen on the touch screen.
I have already said above that the computer can be remote – it can be – it can be networked to control several instruments, but if it is, you need a keyboard at the machine to key in the sample identification. I was even more intrigued to discover that for QC and similar measurements, you don’t even need a keyboard – you can use a bar code reader to identify the sample!
When the spectrum is running, a very attractive icon – a tiny spectrum wriggles before your very eyes at the bottom of the screen. See Figure 2. When the spectrum is acquired it appears in miniature form on the touch screen, see Figures 2 & 3. In many installations a whole gang of users will want to use the machine each with a different set of requirements. This too can be accommodated through a password system.
In the end, people buy on performance. I saw some impressive results on stability and signal:noise ratio (essentially the quality of the spectrum) significant if you are looking at weak bands. The performance is better by more that two in both respects than the P-E Paragon, the machine that Spectrum 1 replaces. Range 7800-350cm-1 but extension to 200cm-1 is promised very shortly and I suspect nir will follow soon. Resolution – ½cm-1, so its more than adequate unless you are seriously interested in gases. Almost all FTIRs have the source and interferometer sealed inside a desiccated base but the manufacturers usually leave the detector area open to the atmosphere. Spectrum One encloses everything other than the sample area. Must be a good idea.
Accessories
Three accessory ‘pods’ are on offer at launch. You remove the sample area lid, slide out the standard absorption base and then slide in the accessory of your choice (limited only by your chequebook). As you do, a small processor on the accessory identifies it in detail (down to its traceability for QC work) and sets up alignment motors built into the pod. Fit the top plate (in the case of ATR) of your choice and another processor defines this. The machine then automatically optimizes so the accessory alignment is ready for you to proceed. In the diffuse reflection accessory, this automatic alignment routine is repeated when the sample or reference are introduced.
Horizontal ATR
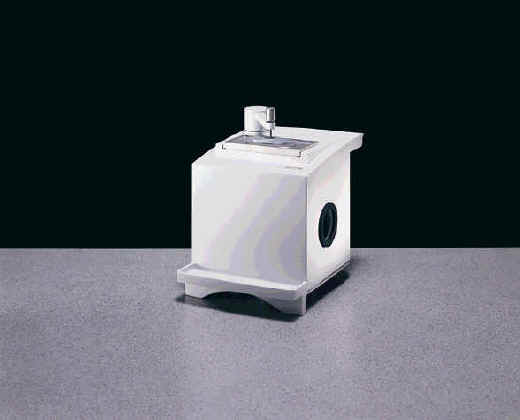
Figure 4. The Spectrum One Horizontal ATR accessory.
The ATR crystal (ZnSe or Ge) is pretty standard in size and can be illuminated at 30, 45 or 60º. To achieve this you need a set of top plates one for each combination of crystal and angle. The top plate is instantly interchangeable and as I have explained, each plate contains a processor, which tells the machine the crystal material and the angle. Troughed and flat plates are, of course, available. Needless to say, you can press the sample on the crystal if it’s a flexible solid. Another processor lower down in the pod controls the alignment routine so the user has to do little or nothing other than putting the sample on the crystal.
Many users may not be aware that changing the angle of the horizontal ATR can be beneficial. By changing the angle the number of reflections can be altered and hence the sensitivity of the technique adjusted. An example is shown in Figure 5.
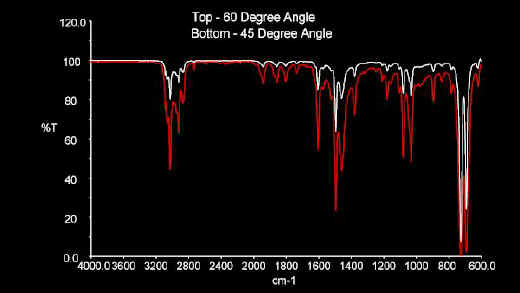
Figure 5. The effect of crystal angle in horizontal ATR.
The sample is toluene
Universal ATR
P-E’s euphamism for diamond ATR – your learned Editor’s favourite technique! Again, its in the form of a plug-in pod and comes with several diamonds allowing 1, 3 or 9 reflections. As with the horizontal ATR, the processor in the top plate sets up the instrument and the second processor in the lower section sorts out the alignment.
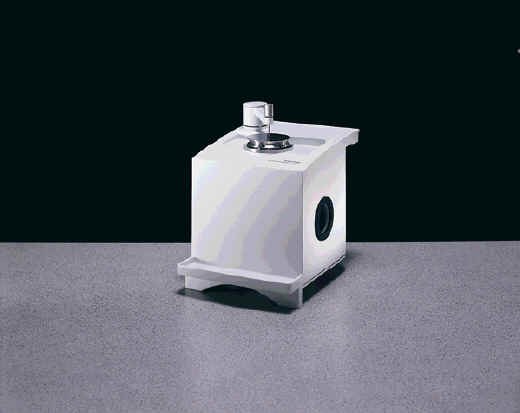
Figure 6. The Spectrum One Universal ATR accessory.
The stainless steel knob is twisted to apply downward
pressure on the sample placed on the horizontal top plate.
In diamond ATR (a bad description because you can use a Geranium [Sorry Germanium – I couldn’t resist that one! -Assistant Editor] prism for some purposes and P-E will oblige. You must press the sample really firmly into the crystal and the force is important. It is essential you apply enough but not too much. In all the existing diamond ATRs available from accessory manufacturers, a torque wrench is normally provided. You wind the pressure screw to a recommended set torque. I love torque wrenches but then I’m a freaky DIY auto mechanic(!), but many people find the procedure clumsy. On the Spectrum One, P-E supplies a force SENSOR. Twiddle the knob to press down on the sample and a green bar grows from left to right on the computer screen, so you know exactly what you are doing. Overdo it and the bar changes to red and flashes angrily at you to tell you to ease off. Have a look at Figure 7. A similar force sensor is fitted to the horizontal ATR.
Figure 7. A diamond ATR spectrum and the Force Gauge readout.
The green bar from left to right shows the pressure is applied.
Diffuse Reflection DRIFTS
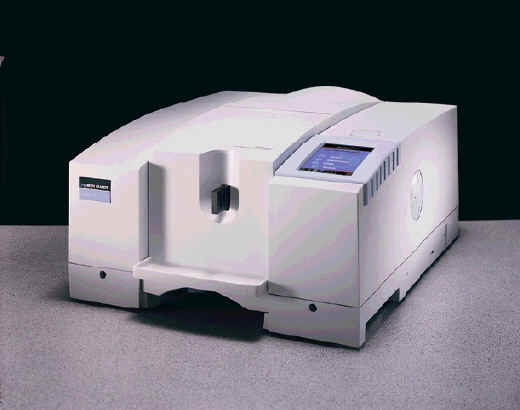
Figure 8. The Spectrum One fitted with the diffuse reflection accessory.
The black vertical rectangle is the sample holder.
DRIFTS is a good technique. Mix a solid with dry KBr at around 5%, put it in a stainless steel cup and reflect mid i.r. off it. Alternatively, rub a small abrasive pad over a specimen and look at the reflection spectrum of the ‘loaded’ pad. The problem with the technique has always been “skill”. You have always had to align the sample in the accessory – get the focus right (focus the incident radiation accurately onto the sample surface) and get the alignment ‘spot on’ so that the reflected light is efficiently collected. All very fiddly! The P-E Spectrum One DRIFTS accessory is fully motorised – when you shove the accessory into the spectrometer, the mirrors adjust the set up to produce a maximum in intensity. So, how do you load the sample? Well, you either fill a cup with KBr/sample mixture and scrape off a nice flat surface OR you rub the sample on the disposable aluminised abrasive pads OR you rub the provided disposable “sticks” on an immovable sample. You then drop the sample into a sample slide rather like a microscope accessory slide, push it into the first position and run the background. Push the holder the whole way in and run the sample. As the reference or sample is shoved into the accessory, the machine re-aligns to maximise the quality of the spectrum. (Even I, after a bottle of Australian Chardonnay couldn’t get it wrong!)
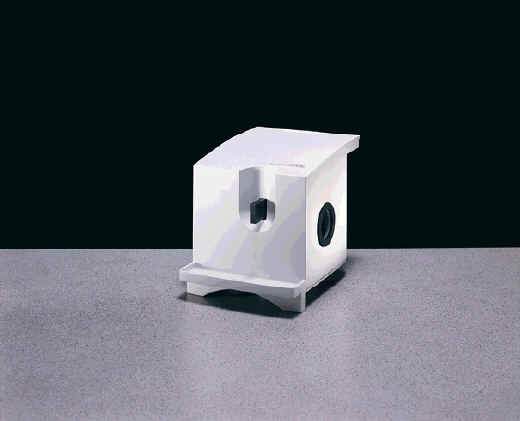
Figure 9. The Spectrum One DRIFTS Accessory
Software
Two bits of software took my eye, but there was an enormous amount to consider. When you run a spectrum on any F-T instrument the spectrum you actually record has a distorted band-shape and band position. The same problem applied in the dispersive days but no one noticed because the spectra were so bad. The problem is that the band-shape and position vary unpredictably from experiment to experiment. This difficulty is fairly subtle and most people don’t notice it, but it does spoil accurate quantitation measurement.
Absolute Virtual Instrument (AVI)
The P-E team has devised an Absolute Virtual Instrument (I know a Virtual Instrument is all you can afford!) The optical bench incorporates a tiny cell containing methane. When instructed, it runs the methane spectrum at whatever resolution you happen to have selected. The machine then generates within memory a spectrum it SHOULD have produced based on the high-resolution data available in the literature. It then compares its real spectrum with the theoretical one and generates a correction algorithm – very clever! Does AVI work? Superbly! If a sample is recorded by several methods, it is inevitable that the perturbation caused by the DRIFTS accessory is not identical to that caused by the ATR pod etc. [AVI does not allow for effects arising from the reflection process itself]. Or, spectra recorded on one instrument from those on another or your instrument has been serviced and hence spectra recorded before and after the service visit are not identical. The errors are not too bad but they are significant in quantitative analysis. Apply the Virtual instrument process and hey presto the spectra all look the same. Look at the example in Figures 10a and 10b.
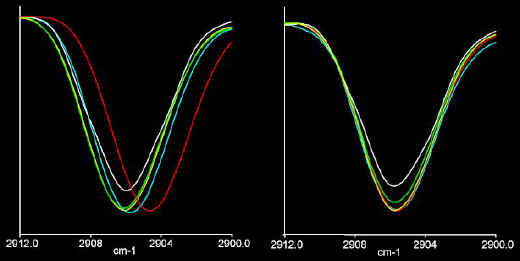
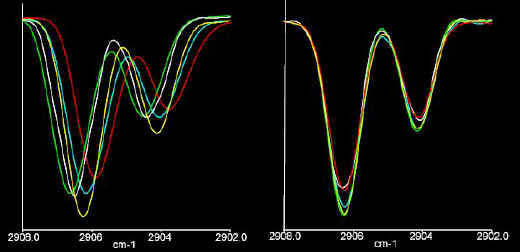
Figures 10a and 10b. In the left hand diagrams you see bands in the gaseous HCl spectrum recorded at 4cm-1 (Figure 10a) and 1cm-1 resolutions (Figure 10b) on different instruments. In the right hand pair of diagrams you see the effect of AVI. Instrument: Instrument differences are effectively removed.
Atmospheric Absorption Suppression
When you run an infrared on a single beam instrument (and all FTIRs are such) you record a background, then a spectrum and the computer then point by point divides one by the other, the spectrum displayed in transmission (0-100%) being a plot of
( I sample/I reference) vs v. Theoretically atmospheric CO2 and water vapour should give no bands because they appear equally in both the sample and reference. In reality, the CO2:H2O ratio is always changing and the H2O level varies continuously and hence real spectra often contain positive or negative CO2 bands and also weak water bands.
These spurious features really are a nuisance particularly if you are looking for weak VC=O or VOH bands. As part of the Spectrum One package you can have a software set to automatically remove these bands. It works really well and is fully automatic.
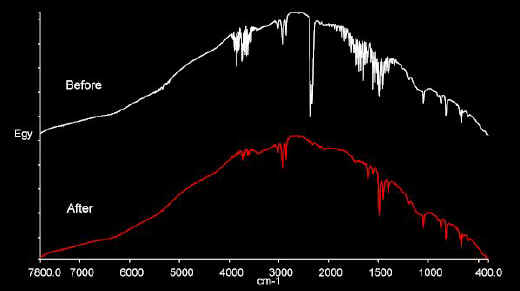
Figure 11. Atmospheric Compensation
IR Expert
This package appealed to me. In essence it looks at the spectrum you have recorded, tells you how well you have done and then applies corrections to get the best out of your data. In Figure 12, you see a spectrum with a high noise level and a quality Report. Note the yellow and red lights at the top. This spectrum didn’t earn a green light. The copy tells you what is wrong. If you then issue the appropriate instruction, the computer will tidy up your handywork. See Figure 13.
To carry out the corrections only a single click is needed – the processes are fully automated. As well as identifying the problems and correcting them the folks at P-E offer advice on how to do better next time – ideal for students and occasional users.
The advice is intoned by a lady with a Scottish accent. At the launch meeting an American marketing man asked – “Why Scottish?”, “because no-one hates the Scots” was the reply! After all, they never embarrass anyone by getting to the Final group in the World Cup!
Figure 12. Checking spectrum quality
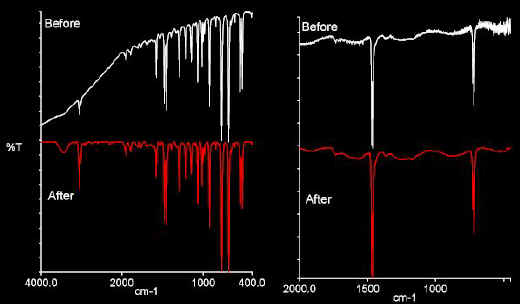
Figure 13.Tuning up poor spectra.
On the left the background is flattened – on the right noise is suppressed
Price
Impossible to give one because as is normal in the instrument industry, the options are huge and the price reflects what you decide to have and how good you are at haggling with the salesman. Put in CD parlance, the Spectrum One is a mid-priced option. It’s certainly not budget price or full price.
Summary
Now the crunch – I accept you would like me to tell you whether to buy Spectrum One. This is beyond the Journal’s remit because we have nothing to compare it with. This report is NOT a road test – it’s a description.
I am prepared to tell you what I liked.
I thought it would be ideal in my research lab because we don’t do high resolution spectroscopy on gases. The S:N ratio is superb and it’s dead stable, so the machine is ideal for working on weak bands. I think Spectrum One is just what is wanted for teaching and service labs – the touch pad and the totally sealed and desiccated optics are attractive. Being able to set up a routine for a particular problem is ideal especially because I don’t have to teach the student or synthetic chemist how to drive the computer.
QC and routine analytical applications – Validation standards can be built in. Search and Quantitative packages are all on offer and the stability must be a very important consideration in this field.
So, there it is – my immediate impression.