Raman Chemical Imaging of Pharmaceutical Content Uniformity

Christopher T. Zugates and Patrick J. Treado
ChemIcon Inc.,
7301 Penn Avenue,
Pittsburgh,
PA 15208,
USA
Abstract
Raman spectroscopy is an efficient means for probing molecular composition, and structure without being destructive to samples. Raman chemical imaging using liquid crystal tunable filter (LCTF) technology is a massively parallel approach that extends traditional Raman spectroscopy to provide information on sample morphology. As a result, Raman chemical imaging is an effective high throughput screening tool for the analysis of pharmaceutical tablet content uniformity. Analysis is performed without sample preparation and characterization of tablets in situ is feasible, even in manufacturing environments as a quality monitoring tool.
Introduction
Rapid, high throughput assessment of the composition, structure and uniformity of active ingredient distribution in drug tablet formulations is of great interest to the pharmaceutical industry. Understanding these parameters is critical to tablet quality monitoring and control. Typical analytical strategies for performing tablet assays often involve invasive sample preparation procedures, including tablet crushing, dissolution and chromatographic separation of active ingredients from excipients. Where tablet content uniformity must be measured, invasive sample staining procedures are often required to generate image contrast between active ingredients and excipients. Active ingredient distribution can then be visualized using optical microscopy, for example. While traditional analytical strategies are effective, they are labor intensive due to the extensive sample preparation required and the techniques are applied to only a very limited number of tablets.
Infrared spectroscopy performed both in the mid IR [1] and near IR [2] provides the potential of rapid determination with little or no sample preparation. Raman spectroscopy also has demonstrated capability for pharmaceutical analysis.[3,4] Vibrational spectroscopic techniques are effective for compositional and structural characterization, as well as quantitation. However, bulk spectroscopy is ineffective for measuring the spatial distribution and architecture of actives which are heterogeneously distributed within intact tablets.
Recent advances in Raman liquid crystal tunable filter (LCTF) imaging spectrometers[5,6] combined with multivariate image processing techniques[7] make Raman chemical imaging a powerful technique for the analysis of wide variety of materials,[8] including pharmaceutical tablet architecture. Some of the materials studied to date include, corrosion systems, [5] polymer blends,[7,9] biological tissues,[10] actinide-contaminated ash samples,[11] surfactants, Martian meteorites [12] and semiconductors.[13] Chemical imaging combines Raman spectroscopy and digital imaging technology to make the assessment of tablet molecular composition and structure a routine analytical procedure. In Raman imaging using LCTFs, thousands of linearly independent, spatially-resolved spectra can be collected simultaneously to differentiate active ingredients even in the presence of complex host matrices. These spectra can then be processed to generate unique contrast intrinsic to analyte species without the use of stains, dyes, or contrast agents. As a result, there is little or no need for sample preparation to characterize heterogeneously distributed active ingredients.
LCTF Raman Imaging Instrumentation
Raman imaging spectroscopy data was collected from a pharmaceutical tablet containing acetylsalicylic acid (aspirin) as an active ingredient using the FALCON Series 3500 Raman imaging microscope system developed by ChemIcon Inc. The FALCON supports a wide variety of laser excitation sources. In the Falcon system shown in Figure 1, a diode pumped Nd:YVO4 solid state laser source doubled to operate at 532 nm is coupled with a multimode fiber optic relay to an infinity-corrected optical microscope. Coupling is performed via an illuminator assembly that converts the infinity-corrected optical microscope to a Raman imaging platform. The illuminator defocuses the laser source and excites the entire sample field of view through a high numerical aperture (NA) microscope objective. The Raman scattering is collected with the same objective and is transmitted back through the illuminator which houses holographic notch rejection filters to remove the Rayleigh scattering. The Raman signal is filtered with a 9 cm-1 bandpass liquid crystal tunable filter (LCTF) constructed using the Evans Split-Element geometry. The LCTF is a compact electronically tunable filter that provides spectral resolution over the entire Raman spectrum comparable to a dispersive spectrometer without compromising the diffraction-limited imaging performance of the optical microscope. Raman images are collected using a thermo electric (TE) cooled (-40 oC) slow-scan charge-coupled device (CCD) detector having 512 x 512 (20 mm square) pixels.
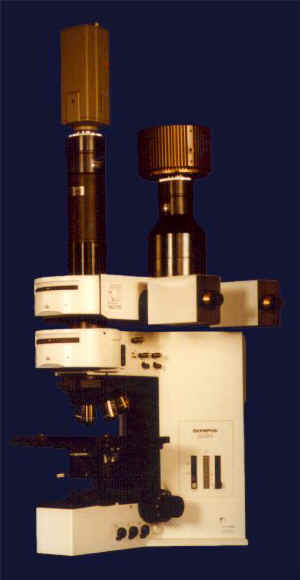
Figure 1. FALCON Raman chemical imaging microscope
Multi-dimensional micro-Raman image data sets were collected under computer control of the LCTF and CCD detector using Acquisition Manager 4.0 software we have developed for commercial use. Multispectral Raman image data sets are processed in ChemIcon’s SpecImage 4.0 software to remove contributions from background fluorescence and enhance molecular-specific contrast using univariate and multivariate analysis approaches. Raman spectra for individual pixels or average spectra for larger domains are visualized using ChemImage 4.0 and extracted for data presentation. More traditional morphometric-based image processing (particle counting, sizing and feature segmentation) is also performed using ChemImage 4.0.
Chemical Image Analysis
We employ multivariate image analysis techniques that involve the application of chemometric techniques to spatially resolved spectra. Chemical (i.e. hyperspectral) imaging experiments produce vast amounts of data and are often subjected to data reduction techniques as an initial processing step. The intent of data reduction is to simplify the analysis by preserving the most important structures found within the data. Less important data structures including instrument response, sample background, and noise are ideally not considered during subsequent analyses.
Factor analysis, a first class of multivariate analysis techniques, is often performed to reduce the amount of data. For example, principal components analysis (PCA) is performed on the data to extract factors or scores that best represent the variation in the chemical image data. PCA reassembles the data as linear combinations of the original variables so that the largest variance in the data corresponds to the first principal component. Each subsequent principal component is orthonormal to the previous component and represents the largest remaining variance in the data. The maximum number of principal components allowed is equal to the number of variables measured and maintains the data structure but does not reduce the dimensionality of the data. Typically, the smallest set of principal components necessary to represent some large percentage of the total variance in the data is used for further analyses.[14]
A second class of multivariate analysis, cluster analysis, identifies differences between the spatially-resolved spectra and sorts them into categories based on differences in their measured variables. Each group of objects is treated mathematically as a single object that represents the variable mean of the cluster to a precision described by the variance or standard deviation within the cluster.[14]
Once the data has been preprocessed, the next task is to estimate the composition of the sample. Conventional algorithms, such as partial least squares, classical least squares, and multiple linear regressions, employ a variety of regressions that fit data populations to a predescribed set of observations made on samples of known composition. The data describing the measurements of the known samples are collectively referred to as a training set and are necessary for most multivariate analyses. In practice, a priori information about a specific sample may be unavailable or incomplete making conventional analysis requiring the use of training sets difficult or nearly impossible. In complex materials, training sets may not be adequate for describing all of the complex chemical interactions that arise in heterogeneous samples. Even when possible, constructing spectral image training sets is labour intensive.
Cosine correlation analysis (CCA) is a multivariate technique that assesses similarity in spectral data sets and image data sets.[7] CCA assesses chemical heterogeneity without the need for training sets. CCA identifies differences in spectral shape and efficiently provides chemical based image contrast that is independent of absolute intensity which makes it well suited to Raman chemical imaging.
To perform CCA, chemical image data is reorganized into an n x p matrix, D, where n is the number of pixels in each image frame and p is the number of frames. Since each frame is acquired at a different wavelength, p is also the number of wavelengths (![]() 1,
1,![]() 2,…
2,…![]() p). Typically, it is necessary to remove bias from the data before analysis by adjusting each spectrum so that the minimum baseline intensity is zero to produce an offset-corrected matrix, D*. In CCA, a comparison is made between each spectral vector in the data set and a reference spectral vector. The correlation between two spectra can be thought of as the cosine of the angle (q ) between the vectors in p dimensional space. The tail of each vector resides at the origin and the heads have the coordinates expressed by the corresponding spectral vector. Because cosq remains unchanged if the lengths of D*Sample and D*Reference are altered, cosine correlation is scale invariant and is immune to non-uniform illumination of the sample and local changes in sample topography until the spectral signal to noise approaches 1. In practice, CCA, is performed pixel by pixel on chemical image data sets. In the resulting CCA image, the correlation score replaces the spectrum at each pixel reducing the dimensionality of the data from p+2 (p spectral dimensions and 2 spatial dimensions) to 1+2 dimensions.
p). Typically, it is necessary to remove bias from the data before analysis by adjusting each spectrum so that the minimum baseline intensity is zero to produce an offset-corrected matrix, D*. In CCA, a comparison is made between each spectral vector in the data set and a reference spectral vector. The correlation between two spectra can be thought of as the cosine of the angle (q ) between the vectors in p dimensional space. The tail of each vector resides at the origin and the heads have the coordinates expressed by the corresponding spectral vector. Because cosq remains unchanged if the lengths of D*Sample and D*Reference are altered, cosine correlation is scale invariant and is immune to non-uniform illumination of the sample and local changes in sample topography until the spectral signal to noise approaches 1. In practice, CCA, is performed pixel by pixel on chemical image data sets. In the resulting CCA image, the correlation score replaces the spectrum at each pixel reducing the dimensionality of the data from p+2 (p spectral dimensions and 2 spatial dimensions) to 1+2 dimensions.
Performing CCA using one reference vector does not insure image contrast between pixels representing different chemical compositions since many different spectra may be reduced to the same cosine score. For example, the collection of spectral vectors having identical cos q values can be conceptualized as lying along the periphery of the multidimensional cone ( a hypercone) having the reference vector for its axis of symmetry and its vertex at the origin. In order to remove all symmetry, p correlations need to be performed on the image data set using p different reference vectors. Even for large p values, most of the symmetry can be removed using only a few reference vectors. As in principal component analysis, it is often unnecessary to perform all possible correlations in order to achieve a high degree of chemical specificity. Ideally, the reference vector space should span the maximum variance of the data space so that most of the variance of the data is contained along the directions of the first few orthonormal reference vectors.
The choice of reference vectors can influence the efficiency of the data reduction. It is not necessary to know the number of pure components in the sample using this method. In fact, a histogram of the scores often reveals the number of spectral types and is useful in determining the number of components in a chemical system. If the number of components is already known, CCA can be used to determine if unknown species (i.e. foreign contaminants) might be present. Even for small numbers of correlations, all wavelength information about the sample is employed in generating the correlation score allowing unsuspected differences in spectral shape to produce image contrast. Chemical identity can be assigned by matching correlation scores from the image data set to correlation scores calculated for the spectra contained in a spectral library using the same CCA routine.
Results
Figure 2 shows images of an over-the-counter pharmaceutical tablet containing aspirin as an active ingredient. While the pressed tablet appears homogenous in the macroscopic-scale image shown in Figure 2A, the tablet appears heterogeneous in the microscopic-scale reflectance image shown in the inset, Figure 2B. The heterogeneity visible in Figure 2B is not surprising given the rough surface topography of the pressed tablet. However, it is challenging to correlate the microheterogeneity visible in Figure 2B with microheterogeneity of the active (acetylsalicylic acid) and excipient (calcium carbonate) materials because both species are white powders and cannot readily be differentiated within an intact tablet using conventional contrast enhancement strategies employed in optical microsopy, including color, differential interference contrast (DIC), nomarski and polarized light.
Figure 2. Aspirin tablet. (A) Macro reflectance image (1mm).
(B) Micro-reflectance image (25µm).
Molecular compositional heterogeneity does exist within the sample at the microscopic level. Raman data shown in Figure 3 provides convincing evidence for the presence of compositional heterogeneity. Figure 3A is the brightfield reflectance image shown in Figure 2B. Raman microspectra are shown at random sampling points, 1-3. Figure 3D shows Raman microspectra captured through the LCTF at the sampling points 1-3. It is obvious from the Raman spectral band shapes that the local composition is varying. For example, the active ingredient, acetylsalicylic acid, has a band at 1044 cm-1 while the calcium carbonate excipient has a band centered at 1060 cm-1. The relative intensities of these two bands indicates the relative concentration of the materials which are clearly heterogeneously distributed at the spatial resolving power of the experiment.
While the randomly sampled Raman microspectra confirm heterogeneity, Raman imaging is required to visualize the distribution of the materials. Figure 3B shows the Raman band intensity collected by tuning the LCTF to 1044 cm-1 and Figure 3C is collected at 1060 cm-1. Note the similarity between the two. Due to the fluorescence background emitting from the tablet, image contrast is dominated by the surface topography of the sample.
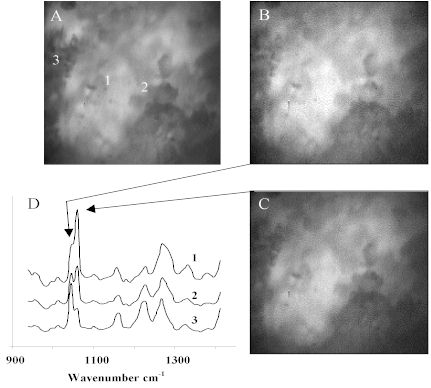
Figure 3. Aspirin tablet. (A) Micro-reflectance image.
(B) Raw active Raman image at 1044cm-1.
(C) Raw excipient Raman image at 1060cm-1.
(D) LCTF Raman microspectra
Scale : 25µm
Susceptibility to surface roughness is a general limitation of Raman imaging based on scattered intensity. However, this problem can be avoided by making use of the Raman spectrum at each linearly independent pixel to generate images based on other spectral band parameters, including subtle differences in spectral shapes. A very effective strategy that compensates for varying sample topography is cosine correlation analysis (CCA), as shown in Figure 4. Figure 4A is a 1044 cm-1 correlation image revealing active ingredient distribution, including the presence of two particles between 20-40 µm in diameter. Figure 4B is a 1060 cm-1 correlation image revealing excipient, which are more uniformly distributed than the actives. Note that CCA is spectral shape dependent, but insensitive to local concerted variations in spectral intensity due to surface topography. As a result, the CCA images shown in Figure 4 differ substantially from the Raman intensity images of Figure 3. Figure 3 and Figure 4 both show microstructure from a small region of the tablet surface. While Figure 3 is showing surface topography, Figure 4 is showing surface chemical composition.
Figure 4. (A) CCA active Raman image at 1044cm-1.
(B) CCA excipient Raman image at 1060cm-1.
Scale: 25µm
The two active ingredient particles are visualized in Figure 5A, a chemical surface map derived from the two-dimensional image of Figure 4A. However, the compositional texture of the tablet becomes more obvious when seen as a surface map. Figure 5B shows the chemical surface map for excipient distribution. As anticipated, where the active ingredient is localized, the excipient is absent.
It is striking that the 1044 cm-1 and 1060 cm-1 spectral features can be used to generate molecular chemical image contrast, as the band centers vary by only 16 cm-1. The images shown in Figures 4 and 5 would be very challenging to obtain using alternative imaging spectrometer technologies. The spectral resolving power of the LCTF is very high due to the narrow spectral bandpass (<9 cm-1) and fine tunability, especially when combined with the excellent sampling statistics available in a typical imaging experiment. For example, it has been demonstrated that the LCTF has a resolving power of greater than 0.03 cm-1 in the study of semiconductors.[15] With regard to other sampling characteristics, LCTF Raman microscopy provides diffraction-limited spatial resolution of 250nm with appropriate high numerical aperture microscope objectives. To capture the raw image data of Figure 3, an integration time of 5 sec/spectral band was employed. Typically, integration times range between 1-30 secs/spectral band and depend on the scattering cross-section of the analyte of interest, its relative concentration and background emission (fluorescence) levels. Typical sample areas that are analyzed from square mm down to square ![]() m.
m.
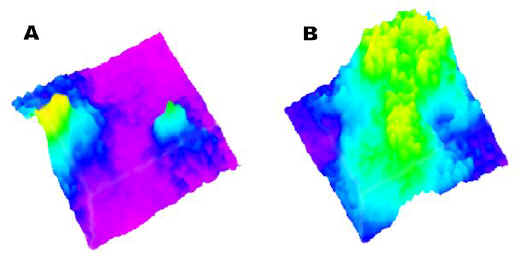
Figure 5. (A) Active Raman chemical surface map.
(B) Excipient Raman chemical surface map.
Conclusions
The recent advancement in LCTF Raman imaging technology is changing the way Raman spectroscopy is being employed for materials characterization, including pharmaceutical tablet analysis. A driving force for change is the desire to understand how sample morphology, composition and structure influence the physical and chemical properties of complex materials. LCTF Raman chemical imaging is gaining wide acceptance by providing users unprecedented capability for molecular characterization of materials, even materials that traditionally have been difficult to assess. LCTFs coupled to CCD detectors facilitate wide field Raman image collection and allow experiments requiring excellent image fidelity to be performed in less time than conventional scanning techniques. By harnessing multivariate image processing, it is becoming possible to analyze materials without sample preparation even in manufacturing environments.
Raman chemical imaging is not limited to microscopic analysis and can be performed on large samples as well. Macroscopic Raman imaging requires lasers to have sufficient power to maintain high power densities across large sample areas. For sample areas of a few square inches, it is possible to attain sufficient laser power with commercially available lasers. Wide field Raman chemical imaging of larger samples requires greater laser power and becomes impractical until mainframe solid state lasers providing higher powers (>10W) become commercially available. However, new generations of diode laser technologies are continually being developed which will facilitate LCTF Raman chemical imaging becoming a universal imaging technique.
References
- J. A. Ryan, S. V. Compton, M. A. Brooks and D. A. C. Compton, J. Pharm. Biomed. Anal. 9, 303 (1991).
- J. D. Kirsch and J. K. Drennen, Appl. Spectrosc. Rev. 30, 139 (1995).
- C. J. Petty, D. E. Bugay, W. P. Findlay and C. Rodriquez, Spectroscopy 11, 41 (1996).
- T. M. Niemczyk, M. Delgado-Lopez, and F. S. Allen, Appl. Spectrosc. 52, 513 (1998).
- Morris, H. R.; Hoyt, C. C.; Miller, P.; Treado, P. J. Appl. Spectrosc. 50, 805 (1996).
- Turner, J. F., II; Treado, P. J. Proc. SPIE – Int. Soc. Opt. Eng. 3061, 280 (1997).
- Morris, H. R.; J. F. Turner, Munro, B.; Ryntz, R.; Treado, P. J. Langmuir 15, (1999) in press.
- M. D. Schaeberle, H. R. Morris, J. F. Turner II, and P. J. Treado, Anal. Chem. 71, (1999) in press.
- H. R. Morris, B. Munro, R. Ryntz, P. J. Treado, Langmuir 14, 2426 (1998).
- N. J. Kline and P. J. Treado, J. Raman Spectrosc. 1997, 28, 119-124.
- G. J. Havrilla, J. Schoonover, F. Weesner, M. C. Sparrow, P. J. Treado, Appl. Spec. 1998, 52, in press.
- Treiman A. H. and Treado P. J., Lunar Planet. Sci. XXIX, 523 (1998).
- Schaeberle, M. D. Treado, P. J. Proc. XVth ICORS, S. A. Asher, Ed., (Wiley, Chichester, 1996) 1188.
- P. Geladi, and H. Grahn, Multivariate Image Analysis, John Wiley and Sons, Inc., New York, NY, 1996.
- M. D. Schaeberle, Raman Chemical Imaging: Development and Applications (Doctoral Dissertation, University of Pittsburgh), 1998.