A Cautionary Tale for Infrared Users
![]()
Editor’s Note
Last time we began to explore the question of backgrounds in infrared spectroscopy. What is the effect of the atmosphere? How does water vapour absorption affect our results? In Edition II I made the point that since water vapour absorbs, it must have an effect on our spectra – if only to lower the available energy or produce interfering peaks. I then reported to readers on a survey we had made on good practice in infrared labs and showed how some labs will accept remarkably poor atmospheric atmospheres, others demand an environment inside their instruments that is essentially completely dry. Every time the latter practitioners open their instruments to introduce a sample, they allow the ingress of wet air and this can be hard to remove. Further, as it is removed the background continuously changes, opening up more potential problems.
I therefore asked Bill Maddams to consider the “background problem”. In the article which follows, he shows how important a stable background is, particularly if quantitative work is intended. Bill then goes on to discuss the effect the characteristics of the instrument has on quantitative results. Much more can be said on both these subjects and I plan further articles.
But enough of my scribbling – here is Bill’s piece.
A Cautionary Tale for Infrared Users, by Bill Maddams
All the absorbers that lie in the infrared beam of a spectrometer will give rise to characteristic absorption peaks – and this means not only the sample but anything else that is in the beam – the atmosphere, coatings on mirrors, beam splitters or windows, anything! The ‘instrumental’ absorbers and those due to the atmosphere may well overlap those of the sample.
The group of sharp infrared peaks from water vapour in the region 1400 – 1800cm-1 due to vibration rotation transitions, and the broader ones from carbon dioxide at about 670 and 2340cm-1, were well known to spectroscopists four or five decades ago, when single beam dispersive spectrometers were the norm. The water vapour peaks posed greater problems than those due to CO2, as they cover the wavelength range where peaks characteristic for C=C and C=O lie, causing difficulties in analytical work, particularly in the estimation of relatively low concentrations of carbonyl-containing compounds.
With the advent of double beam dispersion spectrometers in the late 50’s, such problems seemed to disappear. In these machines, and there were two types, the so-called null balance machines and the more exotic ratio recording instruments, two beams were created, one labelled sample and the other reference. The intensity of the radiation passing through each beam at each infrared frequency was in effect compared. If the atmosphere attenuated the total optical path the two beams, sample and reference, were equally affected and no consequence was noted. If an infrared absorbing sample was present in the sample beam then (ISample)v < (IReference)v and the imbalance was duly recorded. The method worked fine except in two circumstances:
- If the atmosphere absorbed nearly all the radiation, e.g. when CO2 absorbs near 2340cm-1 neither beam contained any energy, hence the sample had little or no effect and
- If a long pathlength gas cell was introduced into the sample beam, atmospheric absorption in that beam could well be less than that in the reference. To get round this one, people tended to use ‘matched’ cells – one full in the sample beam, the other empty in the reference one.
These too are closely spaced sharp multiplets visible as such at high resolution.
An equivalent problem may occur, and frequently does, in Fourier transform infrared instruments. These machines operate as double beam IN TIME rather than IN SPACE as was familiar in the dispersion machines. By this we mean that a background is measured – in effect, the spectrum of the source as attenuated or exaggerated by the instrument. One then measures the spectrum with the sample in place and compares the two. Absorption present in the second spectra but not the first must, of course, then be due to the sample. The procedure adopted is a point-by-point ratioing. If the atmosphere absorbs strongly at frequency v, the ratio determined is that of Intensityv Sample versus Intensityv Background and one is ratioing almost nothing against very little – a somewhat imprecise ratio! All is far from satisfactory but manageable if purging is used and hence atmospheric absorption minimised, but if laboratory practice is sloppy, further problems can be encountered.
Problems may well arise in practice because when purging, dry air or nitrogen are employed to reduce the water vapour concentration in the spectrometer. With most types of instrument the insertion of the sample into the sample chamber will allow the ingress of air into the sample chamber at a relative humidity as high as 70-80%. This water level will then decrease after the sample chamber is closed, because of the continuous purging, to a level approaching equilibrium within the spectrometer. In those situations where interference from water vapour peaks poses problems, it may be necessary to delay the spectral measurement until the water vapour level has fallen appreciably, or is not changing rapidly with time. This may set a limit to the speed with which measurements may be made. An example from the Malaysian Rubber Producers Research Association was included in Vol.1, Edition II.
The effect of carbon dioxide present in the spectrometer is seldom considered, primarily because the CO2 peak at 2350cm-1 is in a position which is clear of the characteristic frequencies for most functional groups. However, there may be situations where it is necessary to monitor or regulate the levels of carbon dioxide within the spectrometer, e.g. if low levels of CO2 in gas samples are being determined. Mismatch between the CO2 levels between background and sample runs is possible for the same reasons as those discussed above in connection with water vapour absorption, and a small negative peak at 2350cm-1 is sometimes seen. This indicates a higher CO2 concentration during the background spectral measurement than is present when the sample is scanned. Bearing in mind that water vapour will gradually displace CO2 from any dessicant in the spectrometer, it is sensible to monitor the carbon dioxide level from time to time by running a background spectrum. High levels should be removed by purging.
There is a second factor which influences quantitative measurements on gas samples and also on liquid/solid samples having sharp peaks, and is probably not widely appreciated. This is the effect of spectrometer resolution and its effect, at least in qualitative terms, is easily demonstrated by reference to Figs. 1 to 4.

Figure 1
Fig. 1 shows the measurement of absorption at a peak position υ0. In the case of a double beam dispersive instrument, the intensity of the reference beam is I0 and it also has this value for an interferometric instrument in the absence of the sample. The intensity value is I in the sample beam of the dispersive spectrometer after the radiation has traversed the sample, and likewise in the interferometric instrument. The detector/output systems of both types of instrument measure the ratio I0/I, or its inverse, and display the result in terms of percentage transmission or absorbance, i.e. log10 I0/I.
The situation shown in Fig. 1 is idealised. It assumes that at υ0 the radiation passing through the spectrometer is wholly monochromatic, i.e. that it covers the range υ0±Δv where Δv→0. This is not achievable in practice.
It is convenient to think about the real-life situation in terms of a dispersive instrument, although the principles involved are exactly the same for interferometric instruments. If the spectrometer is set at υ0 the finite resolution, which is the combined result of the resolving power limit of the prism and/or grating, plus finite slit widths in the optical system, lead to the spectrometer passing a range of wavelengths about υ0.
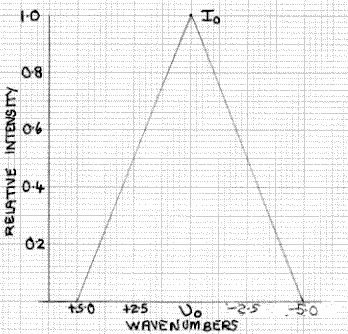
Figure 2: Spectrometer Transmission Function
Half Width 5cm-1
This is illustrated in Fig. 2 which, for simplicity, is shown as a triangular function, although in practice it is likely to be non-linear. At υ0-1 and υ0+1 the intensity is 0.8I0 falling to 0.6I0 at υ0±2, 0.4I0 at υ0±3 and 0.2I0 at υ0±4 wavenumbers. The spectrometer detector integrates the total intensity of this triangular transmission function. Although the transmission function for an FT instrument is of somewhat different form, the consequences are somewhat similar.
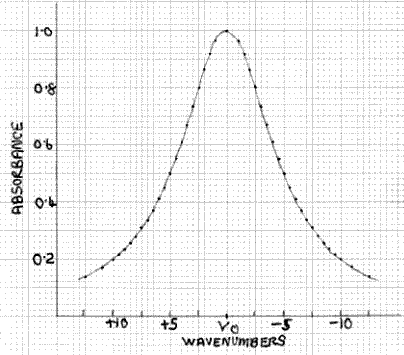
Figure 3: Typical Absorption Band

Figure 4: Combination of Figs. 2 and 3
What is the effect of this on the measured absorbance of a peak such as the one shown in Fig. 3? This can be assessed qualitatively by superimposing Fig. 2 and Fig. 3, as shown in Fig. 4. Here the absorption peak has a half-width (width at half the maximum height) of 10cm-1 and the transmission function has a half-width of 5cm-1. At the absorption maximum, at υ0, the absorbance is 1.0, i.e. the percentage transmission is 10%, which is equivalent to the situation shown in Fig. 1 for monochromatic radiation. Hence, the value of I is 10%. At υ0±2.5 the transmission function intensity has fallen to 50% of its value at υ0, so it is 5%. However, at υ0±2.5 the absorbance of the peak has fallen from 1.0 to 0.8, i.e. a transmission factor of 15.8%, not the 10% at υ0. Hence, the actual value of I at υ0±2.5 is 5×15.8/10 = 7.9%. Likewise, at υ0±4 the transmission function intensity is 20% and the absorbance value is 0.61, with an equivalent transmission value of 24.6%, so the actual value of I at v±4 is 20×24.6/10 = 4.92%. The form of the I function denoted by I´ is shown in Fig. 5, with the broken line indicating I and what it would be if the absorbance value did not change with wavelength. The area of the former, which is what is measured by the detector/output system, is greater than the latter. Hence, it follows that the measured absorbance value will be less than the value of 1.0 obtained with monochromatic radiation, because the spectrometer is measuring the area ratio I0/I´ (Fig. 2) not I0/I. It is easy to see that in the case of a sharp minimum between peaks, the measured absorbance will be too high, as the effect is operative in the opposite direction.
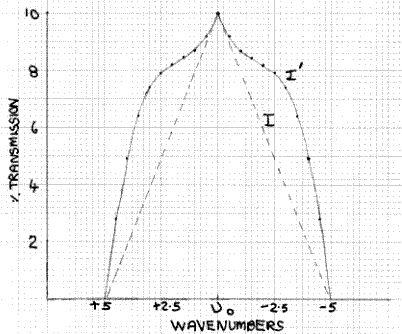
Figure 5: Transmission of sample based on Fig. 4
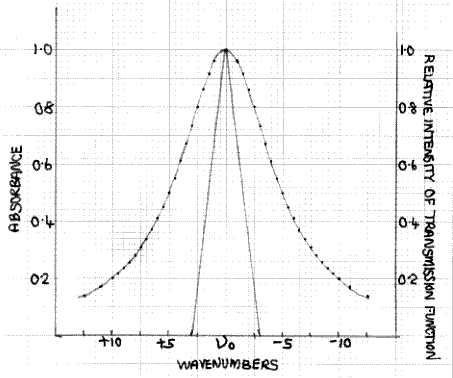
Figure 6: Combination of Fig.3 and a transmission function with a half width of 3cm-1
Fig. 6 shows how the absorption peak of Fig. 3, together with a sharper transmission function, with a half-width of 3cm-1, resulting from higher spectrometer resolution. If we again consider the data points υ0±2.5, the absorbance is still 0.8, i.e. a transmission factor of 15.8%. However, at υ0±2.5 the transmission intensity function has fallen to 16.7% of its value at υ0. Hence, the I´ value is 1.67×15.8/10 = 2.6%. This, of course, is larger than the I value but at this and all other values on either side of υ0, up to υ0±3, where both I and I´ become zero, the difference between the I´ and I curves is less than is the case with the 5cm-1 half-width results shown in Fig. 5. Hence, the reduction in intensity at the peak maximum, resulting from the finite spectrometer resolution, is smaller.
It is clear from these results that the important factor is the half-width of the absorption peak being measured relative to that of the transmission function. A rough rule of thumb that may well prove useful in practice is that if the ratio is greater than about five, the measured intensity reduction is quite small. The width of a spectral band may, of course, be determined experimentally by measuring the spectrum of interest at several resolution values, but this is rather time consuming. The pertinent question is, what are the practical implications of the intensity reduction at the peak maximum? By considering the matter in greater detail it may be shown that, for a given spectrometer resolution and peak width, the reduction in absorbance increases at a rate greater than linear with the absorbance of the peak being measured. Consequently, calibration curves of absorbance vs. concentration are non-linear, and flatten out at higher concentrations and absorbance values. This does not prohibit quantitative work, but the setting up of non-linear calibration curves is more time consuming than for linear plots.
In practice, it is sensible to work with a spectrometer resolution which is high enough to avoid markedly non-linear calibration curves. This, of course, will increase the required spectrometer scan time, for a given signal/noise ratio in the spectrum, and a compromise may be necessary. The problem will not arise to a marked degree in the case of measurements on liquid samples, although peaks from some types of vibrational modes, e.g. the out of plane deformation modes of the hydrogen atoms attached to aromatic rings, give sharp and analytically useful peaks which are narrow enough to give these non-linear calibration curves. Crystalline solids usually have peaks which are typically sharper than those of the materials when examined in the molten state or in solution. Gaseous samples, particularly of smaller molecules, e.g. water vapour and a range of atmospheric contaminants, show varying amounts of fine structure in their spectra and, ideally, should be examined with a resolution of 1cm-1 or better.
So, to conclude this very preliminary opening essay on quantitative measurements – the atmospheric background can seriously affect the quality of the quantitative results we obtain (and can cause annoying interferences to qualitative results as well) and we must worry about resolution. In future editions we plan more detailed articles.
REF: Int. J. Vib. Spect., [www.irdg.org/ijvs] 1, 3, 2 (1997)