Assessment Of The Chlorination of Wool by Infrared Spectroscopy Part I: The Classical Approach
A. L. Woodhead, F. J. Harrigan and J. S. Church
Commonwealth Scientific and Industrial Research Organisation,
Division of Wool Technology,
PO Box 21, Belmont, Victoria, 3216, Australia
Abstract
| We have investigated the use of least squares regression on both raw and second derivative data to develop correlations between mid-infrared Attenuated Total Reflectance spectra and chlorination levels in wool samples. The variability in the results of the multi-step chlorination process commonly used in industry coupled with the formation of a number of reaction products makes the spectra obtained from the treated samples quite complex. Second derivative spectra were required to resolve the two major products, cysteic acid and Bunte salt, before a reasonable calibration could be obtained. The second derivative calibration was used to predict chlorination levels of samples obtained from several commercial mills. By comparison of these results to those obtained using a standard staining test the infrared predictions were found, in general, to be considerably high. It also appears that there could be problems predicting samples with very high levels of anti-chlorination treatment.Index List: FT-IR ATR Spectroscopy, Second Derivative Spectroscopy, Chlorinated Wool, Quantitative Analysis. |
Introduction
Industrial chemical processes can be quite complex [1]. Several reactions can be carried out during a multi-step process. These reactions can produce intermediate as well as secondary products. It is common during these multi-step reactions that little is or can be done in terms of purification and characterisation of intermediates. This could be due to technical impracticality or just the high cost factors involved. When natural products are used as starting materials their inherent variability can further complicate things. In todays highly competitive market place, companies are required to monitor their product, ensuring its quality, whilst reducing the cost of production.
Chlorination, a widely used chemical treatment in the wool industry, is an excellent example of a complex chemical process. It is used extensively in shrink resist treatments as well as a pretreatment for various printing and dyeing processes [2]. The ability to monitor the level of chlorination of the wool is of great importance as too much chlorine can severely damage the fibres and cause difficulty with the application of some dyes, and under chlorination can cause problems with shrinkage. These problems can be expensive for mills to correct, not to mention the cost of the chemicals that are wasted, and ultimately released into the environment, when higher than necessary treatment is applied. In commercial mills the chlorination process is only crudely monitored, usually by titration of the treatment liquors [3] at the beginning and end of a work shift. The chemical effect of the treatment on the wool itself is often not assessed at all unless post-treatment processing problems are encountered.
Wool fibres belong to a group of proteins known as α-keratins. They have two main morphological components, a central cortex consisting of closely packed cells arranged parallel to the fibre axis and an outer sheath of cuticle cells or scales [2,4]. For medium to fine Merino wool fibres, having diameters less than 22 µm, the cuticle is normally one cell thick except where overlap occurs. The cortex of the fine Merino wool fibre, is largely responsible for its mechanical behaviour [4]. It is therefore important to limit the effects of aggressive chemical treatments to the cuticle cells.
The chemistry of the wool fibre is dominated by the sulfur atoms of the disulfide bonds formed between residues of their amino acid cysteine [2]. During the chlorination reaction the disulfide bonds formed between cysteine (Cys) residues are oxidised into cysteic acid residues (C-SO3–) by way of the intermediate oxidation products cystine S-monoxide and cystine SS-dioxide. Minor amounts of these intermediate products are still present at the end of the chemical treatment. The oxidising agent (Ox), which is HOCl, is formed by the reaction of a sodium dichloroisocyanurate with water. The chlorination reaction can be expressed as follows:
| Cys-S-S-Cys + Ox → Cys-SO-S-Cys |
| Cys-SO-S-Cys + Ox → Cys-SO2-S-Cys |
| Cys-SO2-S-Cys + Ox → Cys-SO3H |
The anti-chlorination step, which follows the chlorination step adds to the complexity of the treatment by the production of Bunte salt residues (S-SO3–).
| Cys-S-S-Cys + NaHSO3 → Cys-S-SO3Na + Cys-SH |
FT-IR Attenuated Total Reflectance (ATR) second derivative spectroscopy has become one of the standard method for the semi-quantitative assessment of chemically modified textile surfaces [5]. To date, the majority of these studies have been carried out using samples prepared under controlled laboratory conditions. In this report we have investigated the viability of this approach coupled with classical least squares analysis [6] for the quantitative assessment of the complex changes occurring to the wool fibre surface during commercial chlorination treatments.
Experimental
1. Materials and Treatments
A series of chlorinated fabric standards were prepared by treating a light weight (190gm-2) plain weave fabric with Basolan DC (BASF) which is a sodium dichloroisocyanurate with approximately 60% active chlorine. The treatment process involved the room temperature padding at approximately 70% pickup of fabric samples with varying concentrations of Basolan DC. The Basolan solution included a trace amount of the wetting agent Leophen RA (BASF), and was pH adjusted to 4.5 with acetic acid. The padded samples were allowed to stand for 20 minutes to allow maximum reaction and then given an anti-chlorination treatment for 15 seconds with 2% (w/v) sodium bisulfite solution, at a 20:1 liquor to wool ratio. This was followed by a 15 second rinse in 3% (v/v) hydrogen peroxide solution to neutralize excess bisulfite and a final Reverse Osmosis (RO) water rinse of 30 seconds before drying at room temperature. Additional standards were prepared in a similar manner but the time of the anti-chlorination step was extended to 1, 5 and 10 minutes.
The extent and levelness of the chlorination treatments were assessed by means of a staining test. A solution was prepared by dissolving 1 g of Astrazon Blue 3RL (Bayer, CI Basic Blue 47) and 1 ml Teric N450 (ICI), a non-ionic wetting agent, in RO water and diluting to 1 litre. The pH of this solution was adjusted to 2 with formic acid. Samples were treated by gentle agitation in the dye solution at a liquor to wool ratio of 100:1 for 5 minutes. The samples were then removed from the dye solution and rinsed in cold running water to remove excess dye and allowed to dry at room temperature.
Commercial samples of chlorinated wool top were obtained from several mills. Nominal chlorination levels were provided with these samples.
2. Spectroscopy
Infrared spectra were collected using a Perkin Elmer System 2000 Fourier transform infrared spectrometer equipped with a SPECAC model 11900 variable angle ATR accessory and a narrow band MCT detector. All data were recorded using a ZnSe Internal Reflective Element set at a 45° angle of incidence. Using these experimental conditions the depth of penetration into the sample at 1050 cm-1 is approximately 2 µm [7]. Spectra were collected at a resolution of 4 cm-1 and 32 scans were co-added. Grams Research, version 3, (Galactic Industries Corp) was used for all data collections and spectral manipulations. Second derivatives were calculated using the Savitsky Golay method [8] using a second order polynomial and 5 convolution points. Least squares regression calculations were carried out using Excel 5.0 (Microsoft).
All spectra were normalized on the amide I vibration at 1625 cm-1. The normalization process involves the scaling of a series of spectra so as to equalize the intensity of a specific peak associated with a component present in a constant proportion in all samples. After normalisation the spectral features can then be compared in a relative manner. The need for normalization arises from experimental differences that may not be controllable such as in the case of ATR spectra, variances in sample size and the contact between the sample and the Internal Reflective Element. For the analysis of these wool samples the amide I band was chosen as it’s intensity and band contour should not be effected by the chlorination treatment.
Reflectance spectra (400-700 nm) of the stained samples were recorded using a Pacific Scientific Spectrogard Color System and their relative colour intensities, k/s values [9], were determined at the wavelength of maximum extinction.
Results and Discussion
Mill chlorination treatments will vary depending upon the end use of the wool. The majority of treatments will range between 0.8 and 2.0% chlorination. Treatments, however are carried out at either end of this range, eg. light chlorination, less than 0.8% or heavy chlorination over 2.0%. A series of wool samples covering the range between 0 and 2.8% chlorination, all with a consistent 30 second anti-chlorination step, was prepared. The S-O stretching region of the spectra obtained from several of these samples is shown as Figure 1.
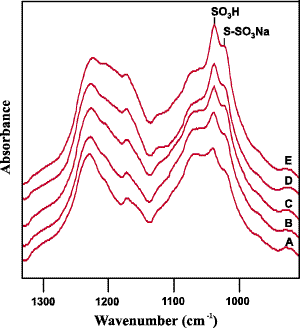
Figure 1: The S-O stretching region of the spectra obtained from an untreated sample (A) and a series of fabric samples with increasing levels of chlorination (B-E).
As discussed above, the main products of the chlorination reaction are cysteic acid and Bunte salt residues. Cysteic acid residues are easily detected in the mid-infrared spectral region as a well-defined absorbance band near 1040 cm-1 [10, 11]. The infrared absorption associated with the formation of Bunte salt residues appears as a shoulder on the cysteic acid peak near 1023 cm-1 [11]. Minor features from both of these chemical species are also present in the 1150 to 1200 cm-1 region. Infrared peaks associated with the intermediate oxidation products cystine S-monoxide and cystine SS-dioxide are observed near 1078 and 1125 cm-1, respectively [10]. The peaks associated with cysteic acid and Bunte salt residues are labelled on the spectra shown as Figure 1.
The purpose of the anti-chlorination step is two-fold, acting to neutralize the excess chlorination reagent and to remove soluble protein from the fibre. Ideally it should have minimal chemical effect on the wool fibre and thus the major end product of the chlorination treatment should be cysteic acid residues. Based on this reasoning our initial attempt to develop a calibration to predict the extent of chlorination was through a least squares regression on the intensity of the 1040 cm-1 band. The data set used for this initial investigation consisted of 18 spectra obtained from multiple regions of 6 fabric samples. The correlation obtained, shown as Figure 2, was found to be rather poor (r2=0.882).
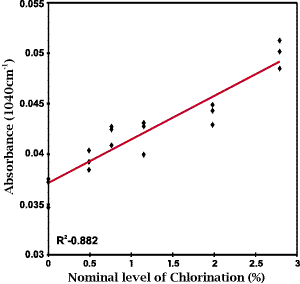
Figure 2: A least squares calibration plot for the nominal level of chlorination based on the intensity of the cysteic acid peak at 1040cm-1.
In order to determine if this poor correlation was due to treatment variability within the sample set the standards were stained with Astrazon Blue and their k/s values determined. Due to the cationic nature of the dye molecules their uptake by the fibre should be enhanced as a function of the increase in anionic sites on the wool surface. As expected for a series of samples prepared from the same parent wool, the k/s values were found to increase linearly with increasing chlorination level. An r2 value of 0.993 was obtained for this correlation indicating that there is most likely no problems with the set of standards.
The partial overlap of the cysteic acid and Bunte salt absorptions could be the major cause of the poor correlation between the intensity of the 1040 cm-1 band and nominal chlorination level. If band overlap is a problem, the analysis could be further complicated as a result of the anti-chlorination step. The use of increasing concentrations of the chlorination reagent with a constant concentration of anti-chlorination reagent would result in the formation of a variable amount of Bunte salt residues within the fibre. For example, at low levels of chlorination there would be a significant amount of anti-chlorination reagent leftover after neutralization of the unreacted chlorine. This excess reagent could then attack the disulfide bonds within the wool fibre forming additional Bunte salt residues. For reaction carried out with high levels of chlorination reagent this effect would not be as great.
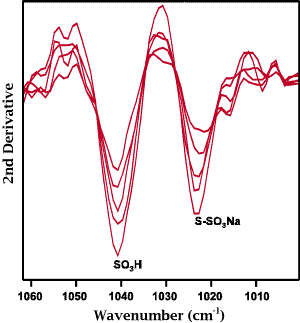
Figure 3: The S-O stretching region of the second derivative spectra obtained from the same series of fabric samples used in Figure 1.
A possible means to resolve the cysteic acid and Bunte salt peaks is through the use of second derivative spectroscopy. As seen from the data presented as Figure 3 this technique not only resolved the two peaks but also removed any question that may arise in the selection of baseline. As noted earlier, second derivative spectroscopy has been used routinely by researchers to assess, in a semi-quantitative manner, the formation of sulfur oxidation products during the treatment of wool [5]. A calibration based on the intensity of the second derivative of the 1040 cm-1 band is shown as Figure 4. The correlation obtained for this calibration, r2=0.939, is significantly improved over that obtained for just the raw data. It is interesting to note that a regression on the intensity of the second derivative of the Bunte salt peak produced a negative correlation thus confirming that the amount of Bunte salt produced during the anti-chlorination step decreased with increasing chlorination level.
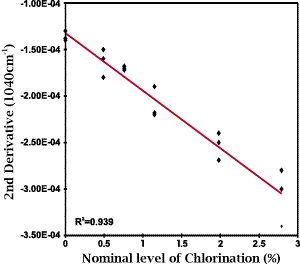
Figure 4: A least squares calibration plot for the nominal level of chlorination based on the intensity of the second derivative of the cysteic acid peak at 1040cm-1.
Standard Errors of Prediction (SEP) were calculated for the calibrations using a small set of six spectra that were not included in the calibrations. Mathematically, the SEP is the square root of the sum of the squared deviations divided by the number of samples. The value of the SEP reflects the variation or scatter about the regression line. The SEP values obtained, which are presented in Table 1, suggest that both of the calibrations have a reasonable potential for predicting chlorination levels. As the next step in the development of the analytical method we recorded the ATR spectra for a number of samples from commercial mills. Several of these spectra are shown as Figure 5. From a comparison of the S-O stretching regions of these spectra it is evident that the levels of anti-chlorination vary greatly. This variance appears to be typical in the products from commercial mills.
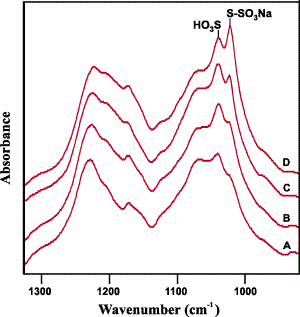
Figure 5: The S-O stretching region of the spectra obtained from an untreated sample (A) and several mill samples with similar levels of chlorination but very different anti-chlorination levels (B-D).
In order to assess the effects of this variation in Bunte salt concentration on the prediction results, a series of laboratory samples were prepared with varying levels of anti-chlorination. Six of these samples were added to the validation set and SEP values were calculated for both calibration models. These results are presented in the column labelled SEP2 in Table 1. The inclusion of the samples with excess anti-chlorination into the validation set significantly degraded the SEP value obtained for the calibration based on the raw data but had no effect on the calibration based on the second derivative spectra. These results indicate that band overlap has a significant effect on the robustness of the calibration.
| Calibration Type | Spectral Range (cm-1) | r2 | SEP | SEP2 |
| Least Squares | 1040 | 0.882 | 0.37 | 0.82 |
| Least Squares | 2nd Der. 1040 | 0.939 | 0.34 | 0.32 |
The chlorination levels for several of the mill samples were predicted using the calibration based on the second derivative spectra. These samples were also subjected to the Astrazon Blue stain test and k/s measurements were made. Chlorination levels were then predicted using the correlation obtained between k/s measurements and chlorination level for the set of standards prepared with constant anti-chlorination treatments. The results obtained for these mill samples are presented in Table 2.
| Nominal % Chlorination |
Predicted % Chlorination | |
| 2nd Der. | Stain Test | |
| 0.8 | 3.3 | 2.6 |
| 1.2 | 2.0 | 1.2 |
| 1.2* | 0.5 | 1.8 |
| 1.9 | 4.5 | 3.7 |
*sample with extreme excess anti-chlorination treatment
From a comparison of the predicted results to the nominal % chlorination provided by the mills it is clear that some of the samples are severely over-treated. The levels of chlorination predicted using the calibration based on second derivative spectra are found in almost all cases to be about 1% higher than the values predicted from the stain tests. The one exception being the mill sample with a very high anti-chlorination treatment which predicted extremely low. This would indicate that even when second derivative spectra are used varying extents of anti-chlorination may have a significant effect on the prediction of chlorination levels. In contrast, the results of the Astrazon Blue stain test do not appear to be as sensitive to changes caused by excessive anti-chlorination.
Summary
Industrial chemical processes are generally quite complex and an often involve multiple steps. The ability to easily and economically ensure that the end product meets the manufacturers specifications is of great importance. We have investigated the use of FT-IR ATR spectroscopy and least squares regression to assess the end result of one such complex multi-step process, the chlorination of wool fabric. The best calibration was developed using second derivative spectra intensities at 1040 cm-1. However, the poor prediction of mill samples indicated that more complex chemometric methods may be required to obtain calibrations robust enough for the prediction of industrial samples. An investigation into the application of the chemometric methods of partial least squares and principle components regression to this problem is reported on in Part II of this study [12].
Acknowledgement
The authors recognise the support of the Australian wool growers and the Australian Government who fund research and development through the IWS. The assistance of Mrs Jill McDonnell for her assistance in the stain testing is gratefully appreciated.
References
1. R. Norris Shreve and J. A. Brink (Jr.), Chemical Process Industries,4th Ed., McGraw-Hill Kogakusha Ltd., 1956.
2. J. A. Maclaren and B. Milligan, Wool Science: The Chemical Reactivity of the Wool Fibre, Science Press, Marrickville, Australia, 1981, p.1-17, p.53-75.
3. Continuous Wool Chlorination with Basolan DC, Technical Information: TX 192e, August 1970 Edition, Badische Anilin- & Soda-Fabrik AG.
4. J. A. Rippon, in D. M. Lewis (Ed.), Wool Dyeing, Bradford: Society of Dyers and Colourists, 1992, p. 1-51.
5. See for example, C. M. Carr and D. M. Lewis, J. Soc. Dyers Col., 109, 21-24 (1993) or D. M. Lewis and G. Yan, J. Soc. Dyers Col., 109, 193-198 (1993).
6. M. J. Adams, Chemometrics in Analytical Spectroscopy, Cambridge: Royal Society of Chemistry, 1995, p. 155-203.
7. J. S. Church and D. J. Evans, J. Appl. Polymer Science, 57 (1995) 1585.
8. A. Savitsky and M. J. E. Golay, Anal. Chem., 36 (1964) 1627.
9. R. McDonald in R. McDonald (Ed.), Colour Physics for Industry, Bradford: Society of Dyers and Colourists, 1987, p. 116-122.
10. E. A. Carter, J. S. Church, R. J. Denning and P. M. Fredericks, Spectrochim. Acta, 50A, 1927-1936 (1994).
11. J. S. Church and K. R. Millington, Biospectroscopy, 2, 249-258 (1995).
12. A. L. Woodhead, F. J. Harrigan and J. S. Church, Vibrational Spectrosc., submitted.
REF: Int. J. Vib. Spect., [www.irdg.org/ijvs] 1, 3, 5 (1997)
