Study of Sample Heating Effects arising during Laser Raman Spectroscopy
![]()
Yvonne D. West
Department of Chemistry, University of Southampton, Highfield, Southampton, SO17 1PF.
Keywords
Raman, Sample heating, Sampling techniques
Abstract
Relatively low laser powers (125 mW) can significantly raise the temperature of a heat sensitive sample. Furthermore, this can result in large temperature gradients across the sampled area. These effects can be reduced by using liquid paraffin mulls and pressed disks as commonly employed in IR studies.
Introduction
Sample heating is a well known problem associated with laser Raman spectroscopy [1] because the sample absorbs some of the incident radiation. In general, the temperature rise depends on quantities such as the thermal conductivity and colour of the sample as well as the laser power and sampling time. To minimise the effect requires an understanding of the amount of sample heating associated with particular experimental conditions and a knowledge of sampling methods available for dissipating the heat. By reducing heating effects, Raman spectra can be recorded for a range of samples which may otherwise undergo a phase transition, decompose or emit radiation as a result of being coloured.
In theory, it is possible to determine the temperature at the point of sampling directly from the Raman spectrum using the ratio of the anti-Stokes and Stokes intensities for a particular vibration and assuming a Boltzmann distribution for the levels involved (v=0 and v=1) [2]. The required formula is:
Equation 1
where v0 is the excitation frequency (cm-1), v is the vibrational frequency (cm-1), k is Boltzmann’s constant, T is the temperature and
![]()
is the vibrational energy gap (J/molecule). However, it is often not convenient, can prove very difficult or may even be impossible to measure this ratio.
Therefore until recently, it has proven difficult to quantify the amount of heating, although a previous study on PTFE estimated a 1°C temperature rise per 100 mW laser power [3]; this is considered to be relatively imprecise.
Sodium Molybdate undergoes a fairly sharp, non-reversible crystal transition at about 112°C (differential scanning calorimetry). The transition, which can be monitored by changes in the Raman spectrum [4], is observed at apparently much lower bulk sample temperatures, suggesting sample heating by the laser. A more detailed study of the transition is described which details the effects of laser heating as a function of apparent (bulk) sample temperature, laser power and sampling time.
It has been possible to record the spectra of some temperature sensitive samples by using cells specially designed to reduce heating, e.g. rotating the sample. An alternative approach is to surround the sample by a good thermal conductor [5]. A selection of highly coloured solid samples, most of which have not previously been studied by n.i.r FT Raman spectroscopy, have been used to investigate such dissipative sampling techniques. In particular, the studies have focused on nujol (liquid paraffin) mulls between KBr, quartz and Pyrex flats and pressed disks composed with KBr and KCl.
Experimental
All Raman spectra were recorded using a Perkin-Elmer 1760 FT Raman spectrometer equipped with a Spectron c.w. Nd3+:YAG laser with TEM00 output at 1064 nm.
Experiments to study the amount of laser heating used samples of standard anhydrous sodium molybdate in a Ventacon hot cell, described elsewhere [1]. Fresh samples were used for each independent experiment and special care was taken to ensure temperature equilibration before recording spectra at
The experiments to investigate methods of sample cooling by thermal transfer in the surrounding medium used highly coloured powdered samples of KMnO4 (purple), graphite (black), NiSO4.xH2O (green), CuSO4.5H2O (blue), Cu(dpta)(NO3)2 (blue), Cu(dien)(ClO4)2 (blue), Cu(dien)(NO3)2 (blue), Cu(dien)Br2 (blue), Cu(dpta)(NCS)(ClO4) (blue) and FeCl3 (very dark yellow; appears black) which are all very heat sensitive [dpta=diphenyltetraamine; dien=diehtylenetriamine]. The Raman spectrum of each sample was recorded at room temperature as the pure sample and using a selection of the following preparations (i) nujol mull between KBr flats, (ii) nujol mull between Pyrex flats, (iii) nujol mull between quartz flats, (iv) pressed disk made from KBr and (v) pressed disk made from KCl. The mull and disk preparation followed the standard procedures used for IR although the disks were, in general, thicker and contained a higher concentration of sample than would be typical for IR use. In each case, the resolution was
Results and Discussion
The results are presented in two sections comprising a discussion on measuring the amount of laser heating followed by an evaluation of the sampling methods for dissipating the heat. If a sample undergoes heating in the presence of incident laser radiation there are a number of possible spectral consequences. The most common effect is the appearance of a broad background feature which has a maximum intensity at the Raman detector cutoff for a near infrared system (~3600 cm-1) and which falls across the spectrum towards the low frequency Raman shift (laser line frequency); the affected region depends on the size of the background feature which is in turn directly related to the amount of laser heating.
For some samples, this feature remains constant for the duration of the scan, in which case a distorted spectrum is obtained (NiSO4.xH2O) which may or may not be acceptable. Often, the background feature continues to gain intensity during the scan as the sample continues to be heated with the eventual result that it completely dominates the spectrum (graphite). Sometimes the broad background feature is not observed but laser heating of the sample is still occurring. The eventual result may be sample decomposition and hence a loss of the spectrum of interest (KMnO4).
Amount of Laser Heating
The crystal transition in Na2MoO4 can easily be observed as changes in the Raman spectrum. Particularly significant is the difference in the strongest band assigned as the symmetric stretch, v1, according to the tetrahedral symmetry of the free molybdate ion. In the low temperature crystal form there are two peaks at 891 and 896 cm-1 but in the high temperature form there is only one at 890 cm-1.
The laser produces a significant sample heating effect and this is illustrated in figure 1 which shows spectra recorded at 250 mW laser power,
Figure 1: Spectra of Na2MoO4 recorded using a laser power of 250 mW, 1 cm-1 resolution, five scans and sample temperatures of: (a) 20°C, (b) 40°C, (c) 55°C, (d) 70°C and (e) 80°C.
Figure 2 shows a series of spectra recorded using a sample temperature of 70°C,
Figure 2: Spectra of Na2MoO4 recorded for a sample temperature of 70°C, 1 cm-1 resolution, five scans and laser powers of: (a) 125 mW, (b) 375 mW, (c) 625 mW and (d) 875 mW.
A further study was undertaken to monitor the changes in the spectrum as a function of time of illumination by the laser beam. The effects are shown in figure 3 using a laser power of 125 mW, sample temperature of 70°C,
Figure 3: Spectra of Na2MoO4 recorded at a sample temperature of 70°C, 1 cm-1 resolution and using a laser power of 125 mW for: (a) 10 scans, (b) 20 scans, (c) 40 scans and (d) 70 scans.
Sampling Techniques to Minimise Laser Heating Effects
The samples chosen for the study are all coloured powders which are difficult to study by Raman spectroscopy because they tend to undergo significant heating in the laser beam and also often absorb the Raman scatter. The techniques used are well known, readily available and involve simple sample preparation. The spectra recorded are summarised in table 1 and a selection, chosen to illustrate the success with different coloured solid samples in a nujol mull, are shown in figure 4.
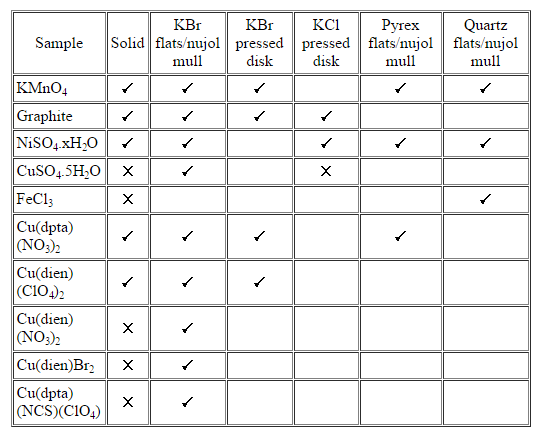
Table 1: Sampling techniques used to record the Raman spectra of some coloured powders. No entry indicates no attempt was made to record the spectrum. A “[tick]” indicates a spectrum was successfully recorded and a “[cross]” indicates attempts to record the spectrum were unsuccessful.
Figure 4: Spectra of different coloured powder samples recorded as nujol mulls between KBr disks: (a) KMnO4 (purple), 800 mW laser power, 1 cm-1 resolution, 10 scans; (b) NiSO4.xH2O (green), 200 mW laser power, 4 cm-1 resolution, 500 scans; (c) Cu(dien)(NO3)2 (blue), 250 mW laser power, 4 cm-1 resolution, 200 scans; (d) FeCl3 (very dark yellow), 45 mW laser power, 4 cm-1 resolution, 500 scans.
Figures 5 & 6 show the spectra recorded under the conditions indicated in table 1 for NiSO4.xH2O and graphite, respectively. These are typical examples. For every sample, all the techniques tried allowed significantly better spectra to be recorded than could be obtained directly from the pure solid. Compared with the pure solid spectra, it can be seen in figures 5 & 6 that the signal intensity increases and the noise level decreases giving greatly improved signal-to-noise ratios, as would be expected when it is possible to have more flexibility and therefore to optimise experimental recording conditions.
Figure 5: Spectra of NiSO4.xH2O: (a) solid, 75 mW laser power, 4 cm-1 resolution, 250 scans; (b) Pyrex flats/nujol mull, 250 mW laser power, 4 cm-1 resolution, 400 scans; (c) KBr flats/nujol mull, 200 mW laser power, 4 cm-1 resolution, 500 scans; (d) KCl disk, 375 mW laser power, 4 cm-1 resolution, 500 scans.
Figure 6: Spectra of graphite: (a) solid, 50 mW laser power, 4 cm-1 resolution, 500 scans; (b) KBr flats/nujol mull, 125 mW laser power, 4 cm-1 resolution, 1750 scans; (c) KBr disk, 150 mW laser power, 4 cm-1 resolution, 1500 scans; (d) KCl disk, 300 mW laser power, 4 cm-1 resolution, 250 scans.
A qualitative idea of the magnitude of this gain is seen by comparison of the intensities of the NiSO4.xH2O peak at 986 cm-1 taken from the best spectra recorded by each method (figure 5).
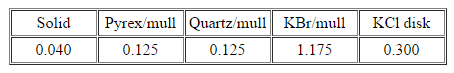
These results, used in conjunction with all the other results, show pressed disks are better at dissipating heat than nujol mulls. Also KCl is better than KBr which in turn is better than both quartz and Pyrex. This trend, as expected, is directly related to the thermal conductivities of these media; values of relevant thermal conductivities are 88, 71 and 38 mWcm-1K at 273K for KCl, NaCl and KBr, respectively when pressed at 8000 atmospheres.
The improvement in the spectra was so pronounced because the effective heat dissipation provided by contact with a medium of good thermal conductivity allowed higher laser powers and longer scanning times to be used. To give an example; as a pure solid, KMnO4 decomposes when laser powers greater than 300 mW are used. For all the sampling techniques used, it was possible to record the spectrum using the maximum available (900 mW) laser power. Another illustration is provided by graphite. At powers of greater than 50 mW the spectrum of pure graphite (a very poor scatterer) is completely dominated by the heating background. When the powder is presented in a KCl disk, powers of up to 300 mW can be employed and the spectrum shows minimal heating effects; it is also possible to record 1000 scans or more with little change in the heating background but vast improvement in the quality of the spectrum.
There are a few potential disadvantages of some of these methods. In pressing disks, the high pressure conditions may result in sample decomposition or degradation as was observed for CuSO4.5H2O. The use of quartz and Pyrex flats resulted in an effective low frequency cut-off at 500 cm-1 (due to their inability to transmit radiation below this frequency) and therefore made the use of these less desirable.
There is no equivalent cut-off problem for KBr flats and, furthermore, they are readily available making them the preferred choice. They do, however, have the disadvantage that they can fog, depending on the experimental conditions. Spectra of samples run as nujol mulls are contaminated to some extent by the spectrum of nujol. This was found to be insignificant in most cases but would be more of a problem if there were bands of interest in the region 2800-3000 cm-1; this could be overcome by using an alternative mulling agent such as hexachlorobutadiene which has no bands in the region of interest. No problems were encountered in recording the spectra due the effective low sample concentration (particularly for the pressed disks) but it should be borne in mind that the signal intensity does depend on the sample concentration; in some cases there may need to be a compromise between signal intensity and heating effects to obtain an acceptable spectrum.
The quality of a Raman spectrum recorded as a nujol mull depends on the particle size, thickness of the mull between the flats and stodginess of the mull. These factors were investigated using NiSO4.xH2O as a nujol mull between quartz flats (thickness) and KBr flats (particle size); each series of spectra were recorded under identical spectrometer conditions. The results were analysed in terms of the heating effect (broad background intensity at high frequency) and peak intensities (comparing the band at 986 cm-1).
Figure 7: Spectra of NiSO4.xH2O recorded as a nujol mull between quartz flats using 250 mW laser power, 4 cm-1 resolution and 200 scans to show the effect of mull sample thickness: (a) 0.25 mm, (b) 0.62 mm, (c) 1.14 mm, (d) 1.71 mm and (e) 2.33 mm.
Figure 7 shows the effect on the spectrum of NiSO4.xH2O due to changing the sample thickness between the flats from 0.25 to 2.33 mm. In general, the amount of sample heating increases with increasing sample thickness. This would be expected because there is poorer contact between the sample and heat dissipating medium. The amount of heating is also a function of the number of scans recorded. The spectral intensity appears to be almost independent of the sample thickness, but very thin samples show slightly weaker signals. Using stodgier mulls marginally increases the heating effect over that seen for runnier ones (more noticeable for thicker samples). However, lowering the proportion of nujol has the advantage of giving a relatively weaker nujol spectrum which necessarily overlays (and therefore contaminates) the sample spectrum. The effect of particle size in the mull is illustrated in figure 8. Decreasing the particle size decreases the amount of sample heating and increases the relative signal intensity. This is consistent with improved contact with the thermal dissipating medium and the expected increase in the scattering cross-section provided by the larger available surface area.
Figure 8: Spectra of NiSO4.xH2O recorded as a nujol mull between KBr flats using 200 mW laser power, 4 cm-1 resolution and 500 scans to show the effect of particle size: (a) coarse, (b) medium and (c) fine.
Therefore, the optimised mull to minimise heating effects should be a fairly thin layer between the flats (![]() 0.5 mm or less), quite stodgy (to maximise sample concentration and minimise nujol effects without compromising heat dissipation) and composed of small particles.
0.5 mm or less), quite stodgy (to maximise sample concentration and minimise nujol effects without compromising heat dissipation) and composed of small particles.
Conclusions
It is possible to use the crystal transition of Na2MoO4 at about 112°C to estimate the laser heating effect during a Raman scan by recording the spectrum of the pure solid. Laser powers of 125 mW raised the sample temperature by 40°C; larger powers were able to raise the temperature by greater amounts. As sodium molybdate is a fine white powder, the effect is likely to be significantly greater for coloured samples thus emphasising the need for alternative sampling techniques for heat sensitive materials. There are also significant temperature gradients across the sampled region. Thermal equilibration can take in the order of 10 minutes exposure to the laser beam.
The use of nujol mulls and pressed disks can significantly reduce the degree of sample heating. In general, pressed disks are better than nujol mulls because higher laser powers can be used and the spectrum is not contaminated with that of nujol but they have the disadvantages that the sample concentration is relatively low and their preparation could result in sample degradation or decomposition. For the methods tried, the effectiveness in minimising sample heating can be qualitatively ranked as:
KCl disk > KBr disk > KBr/mull > quartz/mull ≥ Pyrex/mull >> pure solid
The order is consistent with the thermal conductivity of the dissipating medium.
Further work with nujol mulls revealed the amount of sample heating depends directly on the thickness of the sample layer between the flats and the particle size as well as, to a lesser extent, the stodginess of the mull. Using thinner samples and smaller particles reduces the heating effects because of the improved thermal contact with the flats. Moreover smaller particles give an increased scattering cross-section resulting in stronger signals. Stodgier mulls showed only slightly higher sample heating effects than thinner mulls but their spectra were relatively less contaminated by nujol.
To summarise, if solid samples are significantly heated by the laser beam preventing the successful recording of a Raman spectrum, it is appropriate to try methods normally associated with infrared spectroscopy. Satisfactory results can generally be obtained using a liquid paraffin mull between KBr flats; the mull should contain small particles (well ground sample), be of a fairly stodgy consistency (firmer than toothpaste) and form a layer <0.5 mm thick between the flats. A pressed disk, particularly if made with spectroscopic grade KCl, would give better results provided the sample does not decompose in preparation; such disks can be thicker than and contain a greater proportion of sample than is usual for IR studies.
Acknowledgements
The author thanks EPSRC for financial support and Prof. P.J. Hendra for many helpful discussions.
References
- S.J.A. Pope, Y.D. West, Spectrochim. Acta Part A, 51 (1995) 2011.
- P. Hendra, C. Jones, G. Warnes, Fourier Transform Raman Spectroscopy: Instrumentation and Chemical Applications, p.28, Pub. Ellis Horwood Limited, 1991.
- R.J. Lehnert, Ph.D. Thesis, University of Southampton, 1994.
- S.J.A. Pope, Y.D. West, Spectrochim. Acta Part A, 51 (1995) 2027.
- G.Dent, Spectrochim. Acta Part A, 51 (1995) 1975.
REF: Int.j.Vib.Spect., 1, 1, 5 (1996)