Infrared Spectroscopy on Gases
The Editor
Almost every user of infrared spectroscopy has recorded spectra in transmission at some time or another. The overwhelming fact is that infrared is very strongly absorbed hence thin films of liquids or polymer are always used. Relatively few non- specialists have ever recorded spectra of gases and most labs don’t have a gas cell. In gas phase spectroscopy, the overwhelming fact is that infrared is absorbed weakly hence path lengths are long. Let’s try a few sums.
A typical liquid spectrum would be recorded on a film ~ 20µ thick. The density of the sample if vapourised at 1 atmosphere would be around 10 -3, that of the liquid hence to ‘see’ the same number of molecules as it passes through the vapour, as it did in the liquid, the infrared radiation should pass through ~ 20mm of vapour. If the pressure is below one atmosphere, or, of course, the partial pressure of the sample in a mixture is less than 1 bar the path length would have to be longer than 20mm to do the job adequately. As we shall see MUCH longer paths can be involved.
Rotation
We are all familiar with vibrational behaviour in molecules and its resultant infrared absorption. Those vibrational modes which give rise to a change in dipole will give rise to an absorption in the infrared at the vibrational frequency. Since molecular vibrational behaviour is usually complex we see the familiar fingerprint in the infrared for our molecules.
Gas phase molecules also freely rotate. The rotation gives rise to absorption if again a dipole is involved. Thus HCl will show features due to rotations but Chlorine will not (or rather, not in the I.R. Raman lines DO occur). The rotational spectrum of a molecule consists of a set of equispaced absorption bands, the spacing being inversely proportional to the moment of inertia of the molecule. Most molecules have 3 different moments, a few have only two and linear molecules like CO2 or HCl only one. Thus, most molecules generate a very complex rotational spectrum. The moment of inertia values of all, but the tiniest molecules are sufficiently high that the entire rotational spectrum lies well outside the range of our instruments – in fact the bands are found in the microwave.
Dear oh dear, I hear you all sigh – why does the old duffer bother us with it then? Read on!
In vapours, the molecules both vibrate and rotate and can suffer changes of both simultaneously i.e. in a liquid we see vibrational features, but in the vapour vibration-rotation features. The appearance is shown diagrammatically below
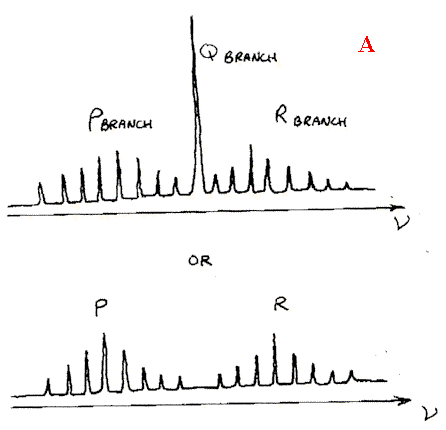
Several points need noting.
- Vibration rotation spectra are symmetrical about either a band (known as the Q branch) or a gap – see A & B respectively above.
- The Q branch whether present or not corresponds to a vibrational transition ONLY. All the other bands are due to vibrational and rotational changes occurring at the same time.
However….
- The frequencies of the Q branches are NOT identical with the equivalent vibrational bands in the liquid. The reason is that molecules in the liquid are squeezed together and hence are perturbed by inter-molecular forces. In the vapour, they are isolated and just do their own thing oblivious of all around them (ALMOST!).
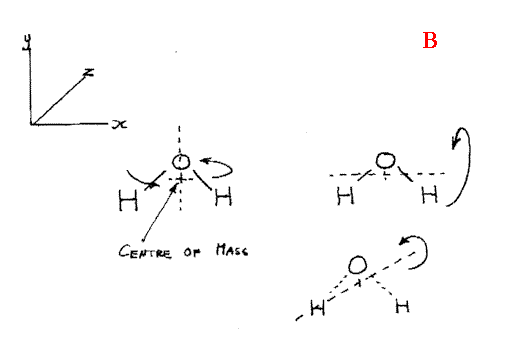
You can see some of these effects by running a background spectrum on your FTIR. The complex band system around 1600 cm-1 is due to the bending motion of water undergoing rotation as well (Oh yes – water has 3 moments of inertia – thus the complexity).
Now look at the two CO2 bands at ~2350 and 670cm-1. If you can run a background at 1cm-1 resolution, you will see finely spaced lines on both. The band system near 2350 is due to the asymmetrical stretch
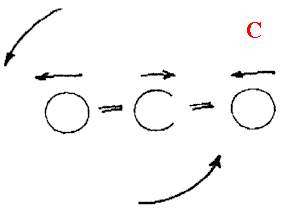
And the rotation 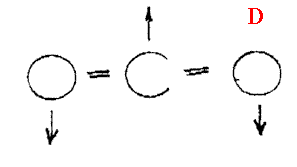
The 667 feature is the bend and again rotating.
CO2 has only one moment of inertia because rotation about the X axis is meaningless, whilst I y= I z.
I said in the beginning that only rotations causing a dipolar effect would give rise to absorptions so how come we see what we do in CO2. Carbon Dioxide has no rotational spectrum, but it does show rotational features on the infrared active vibrational modes. So, we see no vibrational or vibrational rotation features due to the symmetric stretch
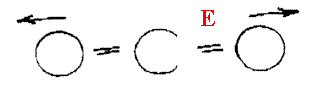
But see both vibrational and rotational features on the two infrared active vibrational modes.
So we see that the infrared spectrum of a gas – even a simple one can be very complex indeed. To see an example or two – have a look at the article which follows this one, where Peter Middleton shows us a spectra of NO (Figure 2), HCl (Figure 4) and SO2 (Figure 6). The bands are very sharp indeed, at reproducible frequencies and hence make excellent diagnostic features in analysis.
As the temperature of a vapour is increased, the relative intensity of the individual bands change – the bands further from the Q branch increase at the expense of the others.
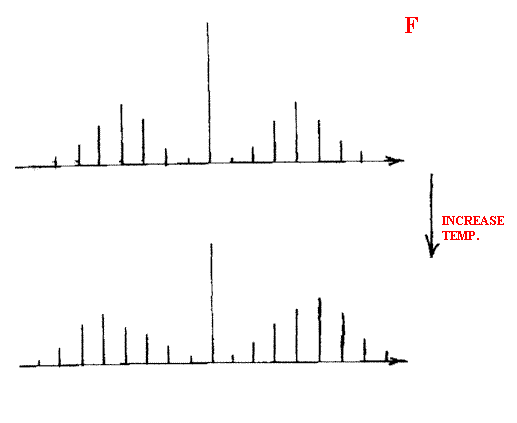
As you raise the pressure, the bands get broader – the reason is that collisions become more numerous and the gas molecules dash about more rapidly. A Doppler shift occurs hence the individual sharp bands become broader.
Analysis of gases using Infrared
The simplest experiment is to pass the gases of interest into a cell and examine the spectrum in transmission. Comparison of the vibrational and vibration rotational bands with standards yields the desired result. A good up-to-date example will be found in our submitted paper section of this edition, where Tom Kaplötke and his colleagues are analysing the gases resulting from explosions.
Sometimes, the gases of interest are at low concentrations e.g. contaminants in air. Clearly, a gas cell that will fit into the sample area of a spectrometer (say 200mm long) is far too short to detect traces. The trick is to use a multi-reflection gas cell. I draw the principles below in Figure G.
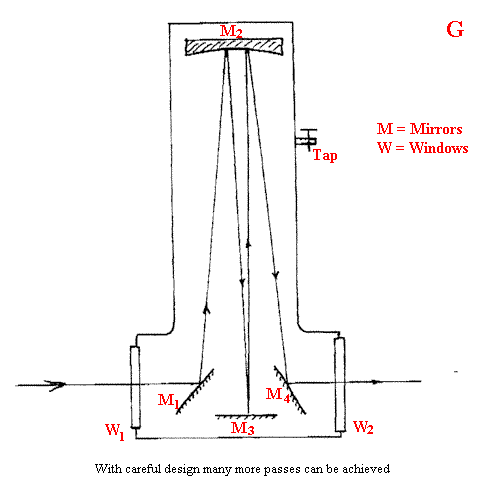
These cells can involve many traces of the gas and hence build up effective pathlengths of more than 10m. From the simple minded calculation I used at the start you can see that it must be possible with these cells to observe gases at partial pressures around a few torr and a good deal better. In fact, you can do even better by running the spectra at high resolution. Let me explain.
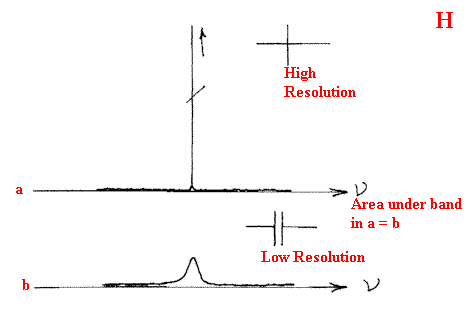
If the bands are naturally very sharp, improving the resolution will make the bands appear more intense until the resolution of the instrument matches the width of the bands at half height. Further improvement will lose sensitivity. So, since the gas phase bands have widths around ½- ¼ cm-1, good instrumentation is certainly an advantage.
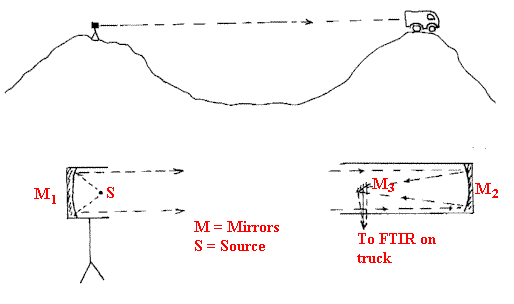
People have extended the path length much further than a few metres. Atmospheric pollution can be monitored using ‘open beam’ working. In this method, the source is set up with a mirror at one site and projects a beam to a collection system/FTIR at another site. One might want to monitor the pollution of the air in a city street – the source will then be on one side of the road, the instrument on the other. Some experiments have been carried out to detect extremely low concentrations of pollutants by mounting the components on hill-tops separated by distances as large as a few kilometres.
Perhaps the most sensitive way to detect atmospheric pollution involves a bit of a cheat. If the air of interest is passed through a tube cooled with liquid nitrogen, it will condense and of course consist of liquid N2, O2, Argon and solid CO2 and solid pollutants. Once enough liquid has been collected, its temperature is raised slightly and the O2, N2 and Ar will boil away leaving the CO2 and pollutants. These are then warmed and examined as mixed gases in a long path gas cell. This method has been used on planes to monitor pollution levels at high altitudes.
All of these methods, clever though they may be suffer from one handicap – expense. The equipment is elaborate and must involve the use of a really good FTIR capable of recording high resolution spectra. There is an enormous and increasing demand for high sensitivity gas analysis on a continuous basis for example, the analysis of flue gases at power stations, incinerators or industrial furnaces. The nature of the gases is well known, their concentration is the analytical problem. A very clever method exists to tackle this problem, which avoids interferometers – in fact it avoids the use of any dispersion technique. The techniques involve gas filters and Peter Middleton of Servomex Ltd has written a paper for us to explain the method. It follows this one.
Applications of gas analysis
Gas phase analysis in atmospheric pollution has been explained already, but in what other areas is it important? Gas phase analysis of decomposition processes can be particularly informative (not only from explosions!). The nature of the gases generated during thermal analysis e.g. Differential Thermal Analysis or Thermogravometric analysis can provide really valuable additional data to help to explain the thermal results. Pyrolysis of components such as polymers can also be particularly informative. Just as in the explosion products paper in Section 3, the gases can be monitored by several techniques at once – mass spectroscopy and FTIR for example.
Chromatographic techniques rely on a detector whose output varies with time as it responds to the separated components. Very often, the detector is non-specific and hence simply records the presence of the separated analyte not indicating its nature. The qualitative identification must rely on the retention time. Much greater specificity is available if the chromatographic system is coupled to a compound specific detector. FTIR and mass spectroscopy are both popular.
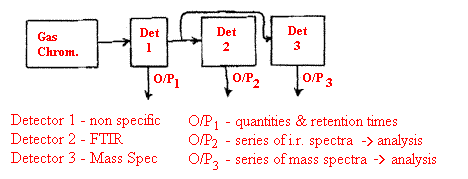
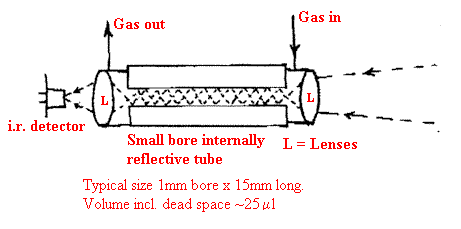
The problem in both methods is that the separated material, the analyte, is present in only a tiny quantity and to prevent condensation, the entire system coupling the chromatograph to the detector (or in our case an infrared cell) and the detector itself must be kept hot. Also, the analyte will be present in the gas stream for only a few seconds at most. For mass spectroscopy there is a relatively small problem because the sensitivity and speed of MS is so high. For FTIR there is a problem. The carrier gas can be chosen to provide no infrared absorption itself e.g. nitrogen but the quantity of carrier gas/analyte can be very small (much less than a millilitre). There is no question of using large gas cells or multi-reflection. The instrument makers have responded by developing really small cells passing the light through them by multi-reflection. The cells are often called ‘light pipes’.
In some industries, vapours and gases are involved in synthesis and for more than 40 years infrared has been used on-line. The petroleum industry frequently uses vapour steams whose purity or composition need continuous monitoring. Infrared systems are often permanently fitted into the production plant and the putput is used to control the system i.e. they operate as detectors in feedback circuits. The instruments used often involve dispersion or interferometric units or sometimes filters but as they are dedicated to specific analyses and must be made robust, rugged, ultra reliable and inherently safe, they differ a great deal from our laboratory systems.
REF: P.J. Hendra, Int. J. Vib. Spect., [www.irdg.org/ijvs] 5, 3, 2 (2001)

