Progress in the Theory of Surface Enhanced Raman Scattering

D. Y. Wu, B. Ren and Z. Q. Tian
Institute of Physical Chemistry and Department of Chemistry,
State Key Laboratory for Physical Chemistry of Solid Surfaces,
Xiamen University,
Xiamen 361005,
China
Email: dywu [at] jingxian.xmu.edu.cn
Abstract
In this article the classical and the most current SERS theories are introduced. We first review the electromagnetic enhanced mechanism based on a flat metal surface, a small metal sphere surface and the fractal surface of metal colloidal clusters. We then consider the chemical enhanced mechanism one which with emphasis the charge transfer principle. Recent advances in SERS mechanisms are then given, involving the combination of the EM and CT theories. Finally, the surface selection rule for SERS are introduced and discussed.
Introduction
Since the first observation of the enhanced Raman signal of pyridine adsorbed on an electrochemically roughened silver electrode by Fleischmann et al. [1], extensive experimental and theoretical investigation of the phenomenon, [later dubbed ‘surface enhanced Raman scattering’ (SERS)] have led to substantial progress in identifying possible mechanisms to explain the effect. Jeanmaire and Van Duyne [2] and Albrecht and Creighton [3], independently proposed that the enormously strong Raman signal measured from pyridine on a rough silver electrode must be caused by some enhancement of the Raman scattering efficiency itself.
Thousands of SERS papers, have appeared to date and hence, several excellent reviews have been contributed by Otto [4], Moskovits [5], Birke and Lombardi [6,7], Creighton [8], Pettinger [9], Campion and Kambhampati [10], and Kneipp and her co-workers [11]. Detailed and some relatively conclusive descriptions of SERS models and mechanisms have been given. In these SERS models, two types of mechanisms are widely accepted: the electromagnetic enhancement effect (EM), which considers the change of the local electric field around the adsorbed molecule. The second phenomenon, the chemical enhancement mechanism primarily involves a charge transfer state between the surface complex of the adsorbed molecule and a metal surface.
In this article we will start by reviewing the electromagnetic enhancement mechanism [in the next section] based on a flat surface, a small diameter spherical surface and the surface of a fractal colloidal cluster – one of the latest advances in SERS EM theory. Then, in Section III we present the chemical enhanced mechanism, in which the charge transfer theory (CT) is mainly discussed. Further recent advances in SERS mechanisms are given in the Section IV, involving the combination of EM and CT theories. Finally, surface selection rule for SERS will be introduced and discussed in Section V.
The Electromagnetic (EM) Enhancement Mechanism
In the EM model, the properties of the surface itself undoubtedly play very important roles in SERS. These properties include the surface shape and size (for example, the existence of small irregularly shaped metal particles, regularly aligned nano-size particles, grating surfaces, colloidal metal particles or fractal aggregates), and also the frequency-dependent dielectric function of the surface materials [5]. The enhancement of the electromagnetic field at a metal surface is primarily caused by the local electric field at the surface, a field that is responsible for the excitation of the Raman radiation and also the radiation of the induced dipole moment of the adsorbed molecules across the rough metal surface.
The Flat Metal Surface
To easily understand the interaction of a surface with incident light, we must at first discuss the interaction of light with the surface (Figure 1).
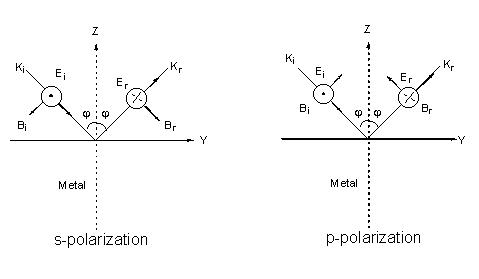
Figure 1. Field vectors of the incident and reflected lights for s-polarization and p-polarization on the flat metal surface. The corresponding propagation vectors, electric field vectors and magnetic field vectors are denoted as ki, Ei, Bi and kr, Ei, Br, respectively. These vectors obey independently the right-hand rule for the incident and reflected lights.
For a plane surface, we have [5,9,12,]
![]()
![]() (1)
(1)
![]()
where the indices p and s indicate the p– and s-polarization directors, and z and ydenote the field components of E parallel to the z and y axes (see Figure 1). The superscript surf denotes the primary field components at the surface, rp and rsare the corresponding Fresnel coefficients for reflection. The positive (or negative) sign before rp and rs is the consequence of a phase shift by 0 (p ) for the reflected wave. The behavior of the reflectivity is easily described using the expressions for the Fresnel coefficients rp and rs for light irradiating a metal surface from the solution to which it is exposed as a function of e (the dielectric function of the metal surface) [5],
 (2)
(2)
where j denotes the incident angle. Note that the dielectric function, e (w , k), depends on the frequency w and the wave vector k of the incident light. However we will neglect the correlation of e (w ,k) with k.
We now start to analyze the effect of the surface on the scattering process itself. The components of the scattering optical field at a metal surface are given, according to the polarization by [12],
![]()
![]() (3)
(3)
in which the primes denote the scattered light. The polarized quantities px, pyand pz are given by
![]()
![]()
![]() (4)
(4)
where a denotes the tensor element of the polarizability. From the above expressions, one obtains four equations for surface Raman intensities [5,9,12],
![]() (5)
(5)
![]()
![]()
Through these equations, certain features of the Raman scattering intensity can be deduced for a molecule adsorbed at the surface [4]. If one ignores the effect of the polarizability tensor, the Raman scattering intensity is determined to a large extent by only two factors, the incident and scattering angles ( j and j ’ ) and the frequency-dependent dielectric function e (w ). Incident angles around 60°[13] and 65° [12] were suggested to enhance most the surface local optical field, hence leading to the maximum intensity of the surface Raman scattering process. For the off-diagonal modes, measuring the spectrum with f = 0° and f ’ = 60°angles are recommended [12]. The dependence of the dielectric function on the frequency of the incident light (w ) will be discussed in detail in the following paragraph.
Assuming the Drude presumption of a harmonic oscillator model and neglecting the interaction of the electron with the magnetic field of the optical field, the frequency-dependent dielectric function can be written as follows [14-16],
 (6)
(6)
where the g is the damping coefficient introduced to allow for the loss of the electromagnetic energy within the metal, and w p is the Drude plasmon frequency, which depends on the number and properties of the free electrons in any given system,
 (7)
(7)
in Eq 7 N, e and m are the number density, the charge and the mass of free electron in the system, respectively. It can be clearly seen that the dielectric function depends on the frequency of the incident light. This formulation will be used to discuss the surface local electric field and the Raman scattering from a flat surface.
We now turn to discuss the local surface electric field. Generally speaking, the plasmon frequency of the coinage metal lies in the visible. Thus, upon changing the wavelength of the incident light towards the red, the dielectric function e will have a negative sign giving a larger absolute value. In this case, rs tends to –1, while rp approaches 1. As a result, the tangential component of the surface field is nearly zero due to the cancellation of the incident and the reflected fields, while the normal component of the incident field is reinforced by the reflected field [12]. Therefore for infrared absorption spectroscopy, only the induced dipole normal to the surface contributes to the intensity.
When the incident light frequency is near to w p, plasmon resonance occurs. In this case, if one neglects the imaging part of the dielectric function, the |e | will be very small, i.e. rs tends to 1, while rp approaches –1. As a result, this leads to an increase in the s-polarization field component and the p-polarization field component along the y direction. In contrast, the p component of the field normal to surface is massively attenuated. For Raman spectroscopy, light in the visible to near ultraviolet region is frequently used as the exciting source, so that the dielectric function is not very small and hence the tangential component of the surface local field will not be zero. Therefore, based on EM theory, the maximum enhancement of the local field at a flat surface is no more than two, leading to a maximum enhancement factor of 16 in the Raman scattering intensity [5].
The Metal Sphere Surface
For the metal spherical surface and rough surfaces, the EM enhanced effects are significantly different from that of the plane. Rough surface with various shapes and sizes can lead to a large enhancement of the surface electromagnetic field by changing the radiationless branch of the surface plasmon polariton (SPP) to a radiative one [4,9,17]. The transition from the radiationless branch to the radiative one means that quanta of the specific field propagates along the surface [9,17,18]. Many theories utilize isolated particles with various shapes to simulate the rough feature of the real surface. This enhanced effect has been used to account for the electromagnetic response of the rough surface, such as in the Lorenz-Mie scattering theory for the small metal sphere [19-21]. Within the long-wavelength limit, solutions of Maxwell’s equations can also be applied to ellipsoidal nanoparticales when investigating size and shape effects [22,23].
An instructive approach for the small metal sphere was proposed by Moskovits [24], subsequently developed by Kerker et al [22,23], and then further extended by Creighton [25]. Placing a small metal sphere with a radius, a, and a molecule in the incident electromagnetic field of magnitude, Ei(r0,w 0), the metal particle will produce an electric dipole, p0, in the centre of the sphere (see Figure 2). The molecule adsorbed onto the surface of the metal sphere will be polarized by the primary electric field Ep(r’,w 0) outside the sphere. The induced dipole p1 of the molecule will then produce the dipole field EDIP(r,w ). Considering the presence of the sphere, the total Raman field ER(r,w ) in the radiation zone must include the dipole field of EDIP(r,w ) resulting directly from the induced molecule and the field of an electric dipole p2 located at the centre of the sphere. The latter field comes from the polarization of the dipole one, EDIP(r,w ), of the molecule. Consequently, the total Raman field ER (r,w ) is given by [23],
 (8)
(8)
Where
![]()
![]()
and g = (e (w )-1)/(e (w )+2) and r’ is the displacement vector of the molecule. The simple expressions for the Raman enhancement of the different vibrational modes of the molecule in the presence and/or the absence of the sphere can be given by [5]
![]()
![]() (9)
(9)
The dependence of the intensity of the Raman scattering on frequency in the above three equations indicates that for the free electron metals, the EM enhancements along different directions will present maxima at frequencies satisfying the surface plasmon resonance condition, Re(e ) = -2. N.B. the particle size influence on the dielectric function needs to be corrected through a damping coefficient, related to the surface polarization of a small sphere with a radius of a. The relation between g and a can be expressed by [26]
![]() (10)
(10)
where vF is the Fermi velocity of the metal and the subscript b presents the damping coefficient of bulk metal.
For a free electron metallic sphere, Moskovits predicted that all three types of modes are almost equally enhanced within a narrow wavelength region to the blue but close to the plasmon resonance frequency [5,27], since in this specific region the field components normal and tangential to surface are equally enhanced. Based on this model, enhanced factors of 106 times for the rough silver surface can be interpreted. However, for a more complex system, recent experiments have shown the existence of the enhancement up to 14 orders of magnitude for the Rhodamine 6G molecule and the other molecules adsorbed on the surface of silver colloid particles and aggregates [11,28].
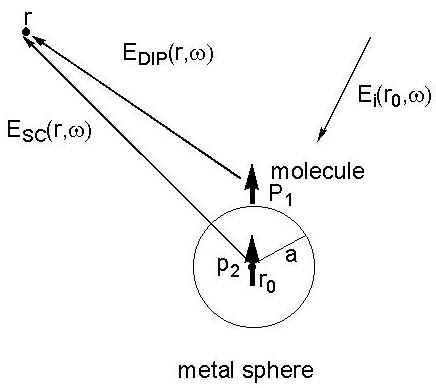
Figure 2. The light scattering process of a molecule adsorbed on a small metal sphere with a radius, a. As the light with the electric field component Ei(r0, w 0) irradiates at the surface, the adsorbed molecule will be polarized by the local field including the incident and Lorenz-Mie fields. p1 and p2 are the electric dipoles. EDIP(r, w ) and ESC(r, w ) radiated from p1 and p2 contribute to the Raman scattering intensity.
The Grating Surface
In contrast to the single particle model, one utilizing gratings to simulate the rough surface is in some ways closer to reality (see Figure 3). The grating model exhibits a spatial modulation of the electron parallel to the x-y plane providing momentum transfer [9,29,30]. In this case, the law of momentum conservation is satisfied leading to the excitation of surface plasmon polaritons (SPP). Though enhancement factors of 106, close to the value commonly observed in experiments, have been predicted based on the model [31,32], there exists a certain limitation for the grating model using the regular surface geometry to simulate the rough surface [31]. Hence this model can provide only partial information of complex surfaces.
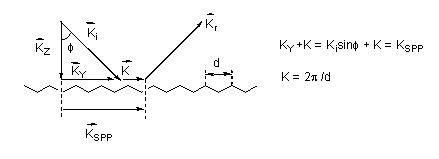
Figure 3. Surface plasmon polariton is excited at a grating by the incident light ki with an incidence angle f that satisfied the conservation of the momentum law.
In a similar manner to that of the molecular assembly, the nanoparticle assembly has become one of the SERS active substrates [33]. The feature of the active substrate is the collective interaction of coupled nanoparticles, such as colloidal particles or metal island films. In this case, the electromagnetic strength can be changed through the coupling interaction between particles or clusters with their neighbors and the substrate [34,35]. Effective medium approximations, such as Maxwell-Garnett (MG) theory [36] has been used to model these collective effects and the influence of substrate when inter-particle interaction and the particle-substrate interactions can not be neglected [5]. As it turns out, the MG theory still cannot be used to treat active aggregates of colloid particles, which generally have sizes larger than the wavelength of the incident light. MG theory depends on the assumption that the particle size is small compared with the wavelength of the incident light [37].
Recent Advances in the EM Theory of SERS
Recent advances in our understanding of the discrete dipole approximation (DDA) have made it possible to evaluate the optical response for particles with various shapes and sizes [37-39] of an arbitrary rough surface. Based on the DDA method, Van Duyne et al predicated Raman enhancement factors in good agreement with the experimental observations. However, as pointed out by Van Duyne, there still exist some differences between theory and experiment, mainly due to shortcomings in describing the actual shape of the particles [37]. Another problem is that the calculation for large assemblies seems too difficult to make. Hence it is very important to combine the DDA with a method that can simulate an actual surface.
It has been long recognized that SERS-active aggregated colloids and rough surfaces are fractal surfaces [40]. Fractals, appearing ubiquitously in nature, are structures possessing self-similar or self-affine and scaling-properties [41]. Both the simple single particle and the grating models fail to describe the EM enhancement factor on the surface. However, a new theoretical approach has recently been developed by Shalaev et al. for predicting the extremely large electromagnetic field enhancement on fractal surfaces [42-45]. Combining the DDA method and the features of fractal, they found the enhanced electromagnetic field was not uniformly distributed on the fractal surfaces. The strongly enhanced effect was found in the special regions – hot areas, and it is in these that the resonance of the electromagnetic radiation is concentrated. The size of the hot area which is predicted to be in the nanometer scale, i.e. they are normally much smaller than the exciting wavelength. While the locations of the hot areas depend strongly on the geometry of the fractal, the excitation wavelength and polarization of the incident laser. Simultaneously it has been demonstrated that the same area can be either a hot spot or cold zone, depending on the excitation wavelength used. Despite the successes of the electromagnetic model, a number of investigations have indicated that another SERS contribution must exist [4-7].
In some experiments the SERS enhanced factors of the first monolayer of sorbed molecules were found to be considerably larger than that of succeeding monolayers. This change in enhanced factors is much higher than that predicted by the electromagnetic theory. The phenomenon originates from some short-range component, and depends on the bonding between the molecules and the surface or interface [4,46]. Further, high-resolution electron energy loss experiments have revealed low-energy charge transfer bands associated with the absorption of such molecules as pyridine [47,48], pyrazine [49], CO, O2 and ethylene [50] over silver. For example, the SERS excitation profile of pyridine on silver sols exhibits a maximum at approximately the same wavelength as that of the absorption peak on the same substrate [51]. The charge transfer from the adsorbed CN– to the silver electrode has also been discussed by correlating the SERS spectrum with the theoretical model [52]. Moreover, the dependence of the SERS enhancement on the frequency is quite different from that of light scattering and absorption in the wavelength region of the plasma resonance [53]. As described by Moskovits, the SERS excitation profile achieves a maximum at a frequency/wavelength that sometimes falls outside the region of adsorption.
Finally, different molecules, whose Raman scattering cross section appear to be almost identical in the gas or bulk, can produce dramatically different intensities in SERS spectra [54]. On the other hand, the enhancement factors for different vibrational normal modes of the same molecule show significant discrepancies. The SERS mechanism which accounts for these phenomena is called the “chemical enhancement mechanism”, and involves chemical bonding interactions and a resonance Raman effect due to a new metal-molecule electronic state or a dynamic charge transfer between the metal and the molecule [4,6,7,10]. The chemical enhancement is expressed as an increase of the ratio of the Raman scattering cross section for the adsorbed molecule over that for the free molecule in a normal Raman experiment [6,7].
The Chemically Enhanced Mechanism
It is widely recognized that the factors which influence the contribution of the chemically enhanced mechanism to the SERS intensity include: the bonding interaction between the adsorbed molecule and surface metal atoms, the orientation and the coverage of the adsorbed molecules, metal surface structures, and the electrode potential [4,6,7]. How these factors could influence the SERS intensity depends on the charge transfer mechanism involved.
The Charge Transfer State
In Raman scattering, charge transfer is a process of virtual excitation [7,55,56] in which the charge-transfer state can be partially resonated with the exciting radiation. This will yield a large contribution to the Raman scattering cross section of the molecule-metal complex [56-58]. It is assumed, and it is possibly the case in most experimental systems, that normally a weak interaction is involved in the substrate-molecule system. In this situation the molecular energy level partially overlaps with the metal conduction band [6]. For this model the degree of charge transfer mixing and the resulting matrix elements for the virtual excitation of the charge-transfer state can be estimated from perturbation theory by solving the Schrödinger equation. Hamiltonian matrix elements are determined by overlap integrals between the orbitals of the metal conduction band and the adsorbed molecules.
Generally, the detailed process of charge transfer can be described by the following four steps [52]: (1) a photon is annihilated, then an electron is excited from a donor (the substrate or the adsorbed molecule) into a hot electronic state; (2) the hot electron is transferred to an acceptor, such as the adsorbed molecule or the metal substrate; (3) the hot electron comes back to the donor from the acceptor and at the same time a Raman photon is radiated; and consequently (4), the complex metal and adsorbed -molecule locates at the special vibrationally excited level of the initial electronic state (see Figure 4).
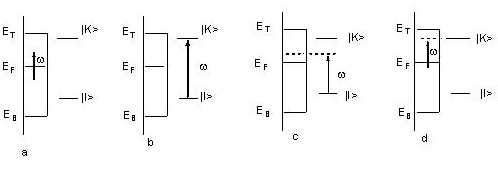
Figure 4. Four kinds of possible interactions of the incident light with an adsorbed molecule at a metal surface. (a) The electron is excited within metal. (b) The intramolecular electron is excited by the incident light. (c) The surface electron of the metal is excited to the adsorbed molecule. (d) The intramolecular electron is excited to an empty orbital of the surface metal above the Fermi level.
However, it is found that charge transfer SERS can have a rather complicated dependence on factors, such as the excitation frequency, the vibrational mode, the adsorbing site, the coverage and the concentration of the electrolyte. All these factors will affect the resonance of the charge transfer band with the exciting radiation, and hence yield a significant influence on the SERS intensity. The contributions to the SERS intensities when the excited states are involved, come from the Franck-Condon and Herzberg-Teller coupling mechanisms [55,57,59].
Effect of Franck-Condon and Herzberg-Teller Couplings
Although the formula argument has been derived and applied to the SERS mechanism by Lombardi and Birke [6,7,57], who developed the vibronic coupling interaction of Albrecht’s theory [60,61], only a simplified calculation is performed for the enhancement of the surface Raman signal. The theoretical predication of the SERS intensity related to the potential for pyridines adsorbed on a silver electrode is in good agreement with the experimental profile of the 1008 cm-1 band. However, for the 840 cm-1 band in the methylviologens adsorbed onto a silver electrode, a large discrepancy from that predicted appears in the more positive region. This is thought to arise because of the reduced reaction from the di-cations to the mono-cation radicals. In fact there are several other factors which could affect the profile [57].
Franck-Condon vibrational coupling generates the overlap of different vibrational substates of the ground and excited electronic states as intermediate states. Based on the harmonic approximation, the overlap is nonvanishing if the electronic states have different equilibrium nuclear configurations and different force constants within the given normal modes. The term contributing to the Raman intensity can be considerably larger than the Herzberg-Teller term for the low-lying electronic excited states, but it is usually effective only for totally symmetric vibrations [6,55,57].
Herzberg-Teller vibrational coupling interaction results from the mixing of the different vibrational states by vibrationally induced charge transfer in the electronic wave functions. The charge transfer contributing to non-totally-symmetric vibrations may take place between some low-lying excited states [62] or between the ground state and the excited states on metal surfaces [59]. In the case where the direct product of the symmetric representations of Herzberg-Teller coupled excited states includes the representation of the vibrational mode, this coupling can lead to an appearance of nonzero Raman activity. The processes are similar to the B term and C term of Albrecht’s theory, respectively [57].
The Wave Packet Method
Recently, the wave packet method from Heller’s time dependent theory [63,64] has been performed by Kambhampati et al. who describe the chemical enhancement of pyromellitic dianhydride on the Cu(100) and Cu(111) single crystal surfaces [65]. In this method, the polarizability is represented in the time domain as a half Fourier transformation of the auto-correction function,
 (11)
(11)
where
![]()
Here h , w , G are Planck constant, the incident light frequency and the homogeneous linewidth, respectively. r and s denote the element of the polarizability tensor along the r and s direction in Cartesian coordinates. In this equation, I and V refer to the ground and purely electronic excited states. The term f refers to the vibrational wave packets which are the eigenstates of the ground state vibronic Hamiltonian. e L is the incident photon energy and e is the zero point vibrational energy. m IV refers to the pure electronic transition dipole between states I and V.
Based on the wave packet method, a simulation is used to interpret the observations in which Raman spectra are sensitive to the incident laser polaization on both crystal surfaces. It was found that the excited state potential surfaces had different shapes and that the respective transition dipole moments had different orientations with respect to the crystal faces. The transition dipole moment that couples the ground electronic state to the excited electronic states is sensitive to the structure of metal surfaces. However, in this model, the Born-Oppenheimer approximation and the Condon approximation were adopted and the Duschinsky mixing [66] and anharmonic effects were neglected.
Effect of Adsorption Site and Orientation
The contribution of charge transfer to SERS intensity depends strongly on adsorption site occupied by the adsorbate at the surface. From vibrational spectroscopy, it is clearly shown that the interacting strength of the chemisorption differs from site to adsorption sites. This implies different overlaps between the wave functions of the surface metal atoms and these of the adsorbed molecule [55]. Due to the differences in the local electronic structure and the geometric structure at the different adsorption sites, the interaction between the adsorbed molecule and surface site will influence the extent of charge transfer. As a result, the variation of polarizability tensors along the normal mode is expected to be quite different.
The adsorption orientation of a molecule can affect the charge transfer contribution to SERS. If the surface molecules change the adsorption orientation on the surface, the charge transfer mechanism may be changed due to the different interaction between the surface and adsorbate. Thus the different charge transfer states at the different orientations may lead to the change in the sizes and the directions of the transition dipole moments. Therefore, the polarizability derivatives with respect to the same normal mode are different at the different orientations. In this case, it is assumed that the optical electric field is locally perpendicular to the microscopically roughened surface. As a consequence the same normal modes have different SERS intensities at different orientations. The adsorptions of pyridine/pyrazine on Ag surfaces have been given as two typical examples. Here Tthe SERS intensities of their different vibrational modes have been were analyzed for the pyridine molecules lying in vertical and flat orientations in thea review by Birke and Lombardi. [6].
Effect of Electrode Potential
In electrochemical environments, the electrode potential can change the direction of the charge transfer and profoundly influence the SERS intensity [6,7,46]. Due to the change in the free-electron density with potential, this results in a shift of the surface plasmon frequency to the blue or to the red. Additionally the SERS is also sensitive to the surface coverage and the components of the solution in these electrochemical systems. These factors affect the free-electron density and in the meantime shift the charge transfer bands. Therefore, it is very difficult to distinguish the contribution of the electromagnetic and the chemical mechanisms, especially when strong adsorption of molecules on the surface occurs. Although some studies have considered both effects, it is still open to exploration as to whether or not there are some co-operative effects between the two mechanisms. This difficulty becomes more severe in explaining the contribution of electromagnetic and charge transfer mechanisms in the study of single molecule SERS. This will be discussed in the next section.
Some Advanced Theories
Single Molecule SERS
Recently the boom in single molecular spectroscopy has led to significant progress in SERS. Surface enhancement up to 1014 has been found in single molecule SERS. Kneipp et al. have used non-resonant near-infrared excitation to successfully detect the SERS of single molecules on aggregated clusters of colloidal silver [67]. On the other hand, Nie and Emory [28] and, recently, Brus and co-workers [68] used the 514.5 nm laser line to detect a dye molecule adsorbed on the surface of silver nanoparticles. These experiments again clearly show that it is possible to detect the SERS signal of a single molecule. The origin of the truly gigantic enhancement challenges conventional SERS mechanism(s) and it becomes a key problem to be explored in our understanding of the SERS effect.
Common SERS-active substrates where the silver approximates to spheres can only provide comparatively low enhancement factors about 106, and can be interpreted by the electromagnetic enhancement. For single molecular SERS, one has to consider the contribution of resonance Raman effects if the target molecule has electronic transitions in the wavelength range close to the excitation laser. Generally, resonance Raman itself can provide an enhancement factor up to 106. Combining these two effects, the total enhancement can then be reasonably explained.
In near-infrared experiments, where no resonant SERS is possible, enhancements of up to 1014 times can still be found, but are to be related to the fractal structure of the silver colloidal cluster [12,67]. Very large field enhancement predicted for fractals by Shalaev, Moskovits and their co-workers provides an explanation to the intense single molecule SERS from silver colloidal clusters [43,44,45]. Therefore, it seems reasonable that the large electromagnetic enhancement of the fractal cluster structures can account for the enhancement factors for single molecule SERS. However, their model does not explain the strong molecular selectivity of the SERS effect and the observations of high SERS on single nanoparticles without fractal structures. Hence one has to think of chemical enhancement mechanisms.
One of the most powerful pieces of evidence comes from a recent experiment on single molecule SERS performed by Brus and co-workers [68]. They observed an extremely large Raman cross section of 10-14 cm2 for rhodamine 6G on silver particles about 100~200 nm in size, but they found no correlation between the intensity of Rayleigh spectra and that of the SERS spectra. This indicates that the strong SERS signal cannot be interpreted only by electromagnetic field enhancement from the small silver sphere model. Additionally, despite electronic resonance occurring at wavelength 514.5 nm in water, the authors did not detect Raman signals for all rhodamine 6G molecules present in the system in the absence of the substrate. Therefore, the chemical enhancement suggested by Otto [4] and Persson [56] must be used to explain the huge SERS intensity from the single molecules interacting with the ballistic electrons in optically excited single large silver particle.
Quantum Mechanical Model
Early in the history of SERS, Persson theoretically predicated that part of the electromagnetic enhancement was due to charge transfer excitation between the metal and adsorbed molecules. [56] Thus, two different charge transfer processes capable of enhancing the Raman intensity have been suggested. The details of the first process have been mentioned in the section III, which mainly increase the Raman differential cross section so as to result in the enhancement of the Raman intensity. A second process involves the transferred charges affecting the surface plasmon resonance frequency and furthermore promoting the electromagnetic enhancement hence making a contribution to the Raman scattering by changing the surface plasmon. In dephasing the dipole plasmon, de-excited surface scattering is more important than the relaxation down to the Fermi level due to the large mean free path for the ballistic electrons. As a result, the amplitude modulation of the scattered radiation is thought to yield strongly enhanced sidebands.
It is necessary to point out that about fifteen years ago Pettinger suggested a quantum mechanical scheme to describe the SERS enhancement based on the SPP model under the interaction of the surface with the light [69]. In this model, the total process is a sequence, the creation of the SPP, its inelastic scattering and finally its annihilation by the radiating photons (see Figure 5). The SERS differential cross section of which can then be expressed as follows,
 (12)
(12)
where sum over m is actually a multiple sum sign running over all electronic excited levels f, h, g , e , g, i , l and sign + indicated the occurrence of seven other terms due to permutation in the same order as the excitation and annihilation steps. G hg denotes the damping constant between h and g states. The Hed and HET denote the Hamiltonian operators of the electric dipole interaction and the energy transfer interaction between virtually metallic and molecular states.
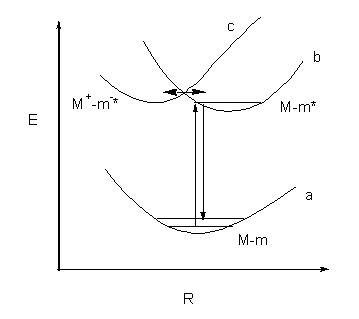
Figure 5. Raman scattering sequences of the adsorbed molecule at the metal surface are shown. a, b and c are the potential energy curves of the unperturbed adsorbed system, non-charge transfer excited state and the charge-transfer excited state respectively. If the effective coupling of two excited states (b and c) takes place, the contribution of charge transfer to the Raman scattering will be important.
This method is able to evaluate the total surface enhancement including the electromagnetic and charge transfer contributions. It rationalizes enhancement factors on a silver surface of 106 times with respect to that in the absence of the silver substrate, in agreement with the Raman experimental results. However the method is very complex, as a result until now it had to be simplified to be employed only in very limited systems.
SERS of Transition Metals
In practice, strong SERS has only been observed on coinage and alkali metal surfaces. This is mainly due to their optical properties vis. coinage metals favour surface plasmon excitation in the visible wavelength region. Furthermore, the imaginary parts of their complex dielectric functions in the region are very small, indicating that the absorption of light is low in the visible or ultraviolet regions, leading to large scattering efficiency [15].
Based on the classical electrodynamic simulations, Cline et al have calculated the EM enhancement factors for the Pt-group transition metals, indicating that these metals should also be SERS active. However, the enhancement factor is much smaller than that reported for the coinage metals [70]. The transition metals normally have larger imaginary parts of the complex dielectric functions and higher surface plasmon frequencies compared with those of the coinage metals. This fact leads to the low SERS activity in the visible region. The insufficiency of the Raman signal has resulted in the sparse Raman study of the transition metal surfaces.
Recently our group has developed a method enabling us to detect Raman signals of adsorbed molecules on the surface of pure transition metals in electrochemical environments by adopting special roughening procedure [71]. The SERS spectra of a number of small molecules have been obtained from pure transition metal surfaces, such as platinum, nickel, iron, cobalt etc [72-75]. The results reveal that the enhancement factor of the transition metals is indeed substantially smaller than that of the coinage metals. Since most of the adsorbed molecules observed in the SERS experiments adsorb strongly onto the substrates of the pure transition metals, hence of course the chemical enhancement may make an important contribution.
To confirm the existence of a charge transfer mechanism, it is essential to record SERS intensity-potential profiles for adsorbed pyridine on the transition metal surface with different excitation wavelengths. The curves recorded from the Fe electrode surfaces reveal that the maximum intensity potential only shifts slightly, i.e., less than 70 mV when the laser line changes from the red to the green [632.8 nm to 514.5 nm] [75]. It is noteworthy that previous investigations on the charge transfer effect have reported that the maximum intensity potential shift was about 250 mV for the pyridine, on electrodes such as Ag. Accordingly, the charge transfer enhancement seems to play an unimportant role for the roughened Fe surface. As for the surface plasmon resonance excited by the laser on the Fe surface, both calculation and experiment suggest that it seems to be impossible to excite the surface plasmon efficiently in the visible light region on the transition metals surfaces. Therefore, other enhancement effect(s) are required to explain the adaptively strong Raman signals from the Fe surface.
Gersten and Nitzan proposed another source for enhancement and related it to the rough surface and named it the lightning rod effect [76]. If a uniform electric field near the surface is applied to a rough metal (of shape say – needlelike ellipsoids), the electric field near the surface is not uniform but is concentrated near the sharpest surface features. This is the familiar principle underlying the operation of the lightning rod. The polarization of the metal in the external electric field produces a strong local field in the vicinity of edges such that in turn molecules appear with enhanced Raman scattering experiencing this field. Very large enhancement ratios may be obtained for a molecule adsorbed along the long axis of such an ellipsoid [76]. According to our experimental results, the lightning rod effect may act as the key role for the enhancement in the system – pyridine adsorption at iron electrodes. More systematic investigation both experimental and theoretical is required to complete our understanding of the SERS effect from transition metal electrodes.
Surface Selection Rules of SERS
An understanding of the surface selection rule is an important part of SERS theory since it determines the activity or silence of normal modes, and whether or not the intensity of the normal mode is enhanced in the Raman scattering process. As described by Greenler, light emitted from adsorbed molecules on the surface can give information about the nature of the adsorbed molecules and details about the adsorption mechanism [77,78]. In the SERS spectrum, the bands can provide information about the adsorption site, the orientation of the adsorbed molecule and the bonding interaction between the adsorbed molecule and the surface. In addition, based on the surface selection rule of SERS, it is possible to design Raman experiments in which the directions of the incident and scattering rays and their depolarization directions can be chosen so as to enable us to determine the particular polarizability tensor elements from the observed Raman intensities [77]. Thus it is essential to have a clear understanding of the SERS selection rule.
There are two popular ways of stating the surface selection rules for SERS. One is to invoke the terms of the image field model suggested by Pearce and Sheppard for absorption spectroscopy [79], and extended by Hexter and Albrecht for surface Raman and IR spectroscopy [17] on planar surfaces. Another method of explaining the surface selection rule for SERS is based on the enhancement of the local electromagnetic fields suggested for the flat metal surface by Moskovits [80] and for small spherical surfaces and developed by Creighton [25] and, independently, Moskovits and Suh[81], who followed the Kerker theoretical formalism [23].
The Image Field Model
In the image field model, image charges are constructed based on the simple method described by Pearce and Sheppard [79]. In this model a dipole parallel to the metal surface has an image dipole in the opposite direction while the image of a dipole perpendicular to the surface is in the same direction as that of its source (see Fig. 6). Therefore, the adsorbate-metal system can be regarded as a molecule-plus-image system. As a result, the Z- axis of the Cartesian coordination frame is selected to be normal to surface and the X- and Y- axes lie in-plane [79].
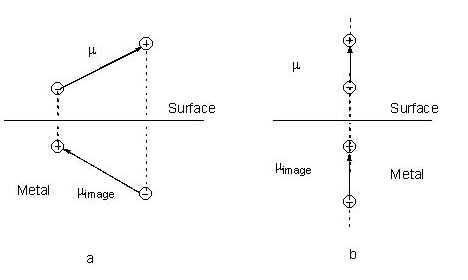
Figure 6. Diagrams giving the image charges and the image dipoles (a) parallel and (b) normal to the surface. The difference in the dielectric constant in two phases is neglected.
Hexter and Albrecht proposed that the process of finding the image of each dipole is equivalent to the addition of a new symmetry operation that characterizes the system involving the adsorbed molecule and the metal [17]. The new operation consists of the simultaneous reflection in the plane of the metal surface, operating on the internal coordinates and charge conjugation together. Thus, in the image model the new symmetry point group consists of the direct product group GÄ C2 of the molecular group G and the symmetry of the image charge, which is isomorphous with the C2 group. As was illustrated in the original paper, for example, the direct product group is D2h if the molecular point group G takes the character C2v. The activity representations of the system, molecule and image, for Raman spectra are those compatible with the totally symmetric representations of C2.
As a result, Hexter and Albrecht concluded that modes belonging to irreducible representations spanning the X2, Y2, Z2, XY and YX components of the derived polarizability will be active while those transforming as XZ and YZ will be extinguished on the surface [17]. Under the limit condition of very high reflectivity, Richardson and Saas concluded that only vibrations with a non-zero Z2 polarizability component were surface active for pyridine adsorbed on the silver surface [82]. From their point of view, in the image model the surface effect is replaced by the image charges/dipoles, while the surface detail is neglected in the surface selection rules. The major advantage of the model is that it uses a simple image charge model to simulate the surface effect on the adsorbed molecule.
The Electromagnetic Field Model
In the electromagnetic field model, two different models of the surface have been suggested. Firstly, on the flat surface the local electromagnetic field consists of the electric field vector of the sum of the incident and reflected light [80], as was suggested by Greenler for Raman spectroscopy [77]. As a result, the tangential component is generally diminished while the normal component is augmented. Consequently, the scattering intensities of the vibrational modes normal to the surface are reinforced. Moskovits has also discussed its applications to other surface enhanced spectroscopies, such as infrared, fluorescence and phosphorescence. A limitation of this model is that if a very good reflector is used, the scattering intensities of the totally symmetric normal modes are the ones increased the most in Raman spectroscopy. The enhancement in intensity is confined to the a zz component [80].
Secondly, on the small metal spherical surfaces, two phenomena must be considered. One is that at visible optical frequencies the electromagnetic field component parallel to the surface of the metals is non zero; another is that the molecular polarizability responsible for Raman scattering is a tensor rather than a vector. Based on these, Creighton derived expressions for the SERS enhancement factor of the adsorbed molecule on a small metal sphere [25]. A similar result also was derived by Moskovits and Suh [81]. They concluded that the differences in the SERS enhancement for the majority of vibrations of actual molecules are related to the symmetry of the Raman tensor of the different vibrations (parallel or perpendicular to the surface). The advantage of the surface selection rule are is that they are able to describe the field directions and magnitudes, and the disadvantage is that they neglect the change of the polarizability tensor elements in determining the symmetry point group for the adsorbed molecules on the surface. As an example, the D6h symmetry point group was used to analyze the surface enhanced effect of benzene adsorbed on the silver surface [80]. Although the Z- axis was selected normal to the surface, the polarizability tensor symmetry of the isolated molecule was used to analyze the surface active Raman normal modes i.e., the lowering of symmetry due to the surface effect was neglected.
The Molecule-Adatom Complex Model
It should be noted that the detailed surface structure surface plays an important role in the surface selection rule for SERS. As mentioned above, in the image field model, the symmetric point group reflects the symmetry of the complex system including the adsorbed molecule and the image charges. The real surface is simulated using the image charges to consider the surface effect [17]. Based on the image model, for a molecule with C2v symmetry, its symmetry will turn out to be D2h for the adsorbed system. This is different from the case of lowering the symmetry of the adsorbate after involving the surface atoms as the whole calculated system, as suggested by Birke et al [6,7].) On the other hand, in the electromagnetic field model the symmetric point group of the free molecule was used while the surface detail is neglected.
Earlier, similar spectral features in EELS (electron energy loss spectroscopyic) for benzene adsorbed on Ni(111) and Ni(100) surfaces [83] indicated that the adsorption site is the same on the two surfaces and the coupling between the adsorbed benzene with the neighbouring metal substrate atoms is very weak. So for these two surfaces it is reasonable to use the same symmetry group, so that the vibrating system was taken to include only the molecule and its bonding site. In order to reconcile the geometry on the two surfaces, they considered preferential bonding of the benzene molecule to a single nickel atom (symmetry C6v) or to two adjacent surface metal atoms (symmetry C2v). Their results implied either that the molecule is not sufficiently coupled with the substrate to be sensitive to the surface geometry, or that the chemisorption bond is influenced less by isolates the adsorption site from its neighboring Ni atoms. Therefore, for both Ni(111) and Ni(100) surfaces, the surface complex , combining involving the adsorbed molecule and plus the surface atoms can be considered to have the same adsorption sites, [83].
Based on these ideas, for a more complete understanding of the surface selection rule for SERS one has to consider the surface complex (a combination of the adsorbed molecule and the corresponding adsorption sites) and the surface local electromagnetic field, including its direction and the magnitude of the primary field vector. This model should provide an appropriate interpretation of the Raman spectra of molecules observed in local surface environments.
The SERS spectra of benzene molecules on silver [84,85] and gold [86] surfaces have been studied both experimentally and theoretically. All the Raman-allowed modes exhibit the intensities that are consistent with a flat orientation. However, some Raman-forbidden modes in the bulk phase clearly appear in the SERS spectrum. Nonetheless, when a benzene molecule is adsorbed onto a silver or gold surface the inversion centre is removed due to the presence of the adsorption sites. Thus the symmetry point group C6v or C3v should be used, leading to some of the Raman modes silent under the point group D6h becoming Raman active. Thus, all of the normal modes withrelated to the inversion center becomechange Raman active. There is an special exception, for example, the band for the Raman-forbidden a2u mode, a band of which has been observed at the silver and gold surface in the SERS spectra. Its presence has been interpreted by Moskovits et al. [87] and Campion et al. [88] using local surface field effects rather than the molecular symmetry lowering [87]. Actually there are slight differences between the two models. The former mainly reflects the change of the electromagnetic field, while the latter reflects the change in the polarizability. Although the a2u mode for the adsorbed benzene at the silver surface is dipole transition Raman-forbidden, we found that the term of the dipole-quadruple polarizability tensor includes both the polarizability and field components; albeit the polarizability is rather small. However, there is a large contribution from the field components and hence we can still observe the Raman signal of this mode.
In summary, our theoretical understanding of SERS has experienced considerable advances as a result of modeling methods and computational techniques, allowing us now to understand the interactions of the surface the adsorbate and light. However, the theoretical formulations have been established gradually over the past two decades, more and more experimental evidence and new observations, such as SERS from single molecule and from transition metals, have provided challenges to the present theories. Thus, further detailed analyses of SERS enhancement are still required. Based on the appropriate model, we hope that the true nature of SERS and an accurate prediction of its intensity will be revealed in the near future.
References
- M. Fleischman, P.J. Hendra, A.J. McQuillan, Chem. Phys. Lett., 26, 163 (1974).
- D.L. Jeanmaire, R.P. van Duyne, J. Electroanal. Chem., 84, 1 (1977).
- M.G. Albrecht, J.A. Creighton, J. Am. Chem. Soc., 99, 5215 (1977).
- A. Otto, Light Scattering in Solid, Vol. IV, Eds. M. Cardona & G. Guntherodt, 289-418 (1984).
- M. Moskovits, Rev Mod. Phys., 57, 783 (1985).
- R.L. Birke, J.R. Lombardi, Spectroelectrochemistry: Theory and Practice, Chapter 6, Surface-enhanced Raman Scattering, edited by R.J. Gale, Plenum Press, New York, 1988.
- R.L. Birke, T. Lu, J. Lombardi, Techniques for Characterization of Electrods and Electrochemical Processes, Chapter 5 Surface-Enhanced Raman Spectroscopy, John Wiley & Sons, Inc. 1991.
- J. A. Creighton, Spectroscopy of Surfaces, Chapter 2 The Selection Rules for Surface-enhanced Raman Spectroscopy, edited by R.J. H. Clark, R.E. Hester, John Wiley & Sons, Inc. Chichester, 1988.
- B. Pettinger, In situ Raman Spectroscopy at Metal Electrodes, Adsorption of Molecules at Metal Electrodes, Ed. J. Lipkowski, P. N. Ross, VCH, 1988.
- A. Campion, P. Kambhampati, Chem. Soc. Rev., 27, 241 (1998).
- K. Kneipp, H. Kneipp, I. Itzkan, R. R. Dasari, M. S. Feld, Chem. Rev., 99, 2957 (1999).
- M. Moskovits, J. Chem. Phys., 77, 4408 (1982).
- R.G. Greenler, T.L. Slager, Spectrochim. Acta A, 29, 193 (1973).
- L. Genzel, U. Kreibig, Z. Physik B, 37, 93(1980)
- N.W. Ashcroft, N.D. Mermin, Solid State Physics, Wiley: Sauders College: Philadelphia, 1976.
- S.Z. Quan, Electromagnetic field and electromagnetic wave, Sichuan Sci. & Tech. Press, 369 (1990).
- R. M. Hexter, M. G. Albrecht, Spectrochim. Acta A, 35, 233 (1978).
- J. A. Creighton, Spectroscopy of Surfaces, Chapter 2 The Selection Rules for Surface-enhanced Raman Spectroscopy, edited by R.J. H. Clark, R.E. Hester, John Wiley & Sons, Inc. Chichester, 1988.
- G. Mie, Ann. Phys. (N.Y.), 25, 377 (1908).
- H.C. van de Hulst, Light scattering by small particles, Dover Publication: New York, 1981.
- M. Kerker, The scattering of light and other electromagnetic radiation,Academic, New York, 1969.
- M. Kerker, Applied Optics, 18, 1180 (1979).
- M. Kerker, D.-S. Wang, H. Chew, Appl. Optics, 19, 4159 (1980).
- M. Moskovits, J. Chem. Phys., 69, 4159 (1978).
- J.A. Creighton, Surf. Sci., 124, 209 (1983).
- C. G. Granqvist, O. Hunderi, Phys. Rev. B, 16,3513 (1977).
- M. Moskovits, J.S. Suh, J. Phys. Chem., 88, 5526 (1984).
- S. Nie. S.R. Emory, Science, 275, 1102 (1997).
- P.K. Aravind, A. Nitzan, H. Meitu, Surf. Sci., 110, 189 (1981).
- A. Wirgin, T. Lopez-Rios, Opt. Commun., 48, 416 (1984).
- F. J. Garacia-Vidal, J. B. Pendry, Prog. Surf. Sci., 50, 55 (1995).
- M. Xu, M. J. Dignam, J. Chem. Phys., 100, 197 (1994).
- K.C. Grabar, R.G. Freeman, M.B. Hommer and M.J. Natan, Anal. Chem.,67, 735 (1995).
- H.F. Chen, J. Wang, S.M. Cai, Z.F. Liu, Chem. J. Chinese Univer., 20,620 (1999).
- J.L. Yao, G.P. Pan, K.H. Xue, D.Y. Wu, B. Ren, D.M. Sun, J. Tang, X. Xun and Z.Q. Tian, Pure Appl. Chem., 72(1) (2000) in press.
- J.C. Maxwell-Garnett, Philos, Trans. R. Roc. Lond, 203, 585 (1904);
- J.C. Maxwell-Garnett, Philos, Trans. R. Roc. Lond, 206, 237 (1906).
- T. R. Jensen, G.C. Schatz, R. P. Van Duyne, J. Phys. Chem., B, 103, 2394 (1999).
- B. T. Draine, P. J. Flatau, J. Opt. Soc. Am. A, 11, 1491 (1994).
- W.H. Yang, G.C. Schatz, R.P. Van Duyne, J. Chem. Phys., 103, 869 (1995).
- O. Siiman, H. Feilchenfeld, J. Phys. Chem., 92, 453 (1988).
- J. Feder, Fractals, Plenum: New York, 1988.
- S. Gresillon, L. Aigouy, A.C. Boccara, J. C. Rivoal, X. Quelin, C. Desmarest, P. Gadenne, V.A. Shubin, A.K. Sarychev, V.M. Shalaev, Phys. Rev. Lett., 82, 4520 (1999).
- W. Kim, V.P. Safonov, V.M. Shalaev, R.L. Armstrong, Phys. Rev. Lett., 82, 4811 (1999).
- V. A. Markel, V.M. Shalaev, P. Zhang, W. Huynh, L. Tay, T.L. Haslett, M. Moskovits, Phys. Rev. B, 59, 10903 (1999).
- V. M. Shalaev, Phys. Rep., 272, 61 (1996).
- T.E. Furtak, D. Roy, Surf. Sci., 158, 126 (1985).
- J.E. Demuth, K. Christmann, P.N. Sanda, Chem. Phys. Lett., 76, 201 (1980).
- J.E. Demuth, P.N. Sanda, Phys. Rev. Lett., 47, 57 (1981).
- J.E. Demuth, P. Avouris, Phys. Rev. Lett., 47, 61 (1981).
- D. Schmeisser, J.E. Demuth, P. Avouris, Chem. Phys. Lett., 87, 324 (1982).
- J. A. Creighton, C.G. Blatchford, M.G. Albrecht, J. Chem. Soc. Faraday Trans., II, 75, 790 (1979).
- A. Otto, J. Billmann, J. Eickmans, U. Erturk, C. Pettenkofer, Surf. Sci., 138, 319 (1984).
- J. A. Creighton, M.G. Albrecht, R.E. Hester, J.A.D. Matthew, Chem. Phys. Lett., 55, 55 (1978).
- M. Moskovits, D.P. DiLella, Surface Enhanced Raman Scattering, edited by R.K. Chang, T.E. Furtak, Plenum, New York, p243,1982.
- F. J. Adrian, J. Chem. Phys., 77, 5302 (1982).
- B.N.J. Persson, Chem. Phys. Lett., 82, 561 (1981).
- J. R. Lombardi, R.L. Birke, T. Lu, J. Xu, J. Chem. Phys., 84, 4174 (1986).
- A. B. Myers, Chem. Rev., 96, 911 (1996).
- M. E. Lippitsch, Phys. Rev. B, 29, 3101 (1984).
- A.C. Albrecht, J. Chem. Phys., 34, 1476 (1961).
- J. Tang, A.C Albrecht, Raman Spectroscopy: Theory and Practice, vol. 2, edited by H. A. Szymanski, Plenum, New York-London, p33, 1970.
- P. Corio, J. C. Rubim, R. Aroca, Langmuir, 14, 4162 (1998).
- S.-Y. Lee, E. J. Heller, J. Chem. Phys., 71, 4777 (1979).
- E. Heller, R. L. Sunberg, D. Tannor, J. Phys. Chem., 86, 1822 (1982). 108, 5013 (1998).
- F. Duschinsky, Acta Physicochim. (USSR), 7, 551 (1937).
- K. Kneipp, Y. Wang, H. Kneipp, L.T. Perelman, I. Itzkan, R.R. Dasari, M. S. Feld, Phys. Rev. Lett., 78, 1667 (1997).
- A. M. Michaels, M. Nirmal, L.E. Brus, J. Am. Chem. Soc., 121, 9932 (1999).
- B. Pettinger, J. Chem. Phys., 85, 7442 (1986).
- M.P. Cline, P. W. Barber, R.K. Chang, J. Opt. Soc. Am., B, 3, 15 (1986).
- Z.Q. Tian, J.S. Gao, X.Q. Li, B. Ren, Q.J. Huang, W.B. Cai, F.M. Liu, B.W. Mao, J. Raman Spectrosc., 29, 703 (1998).
- Z.Q. Tian, B. Ren, B.W. Mao, J. Phys. Chem. B, 101, 1338 (1997).
- J.S. Gao, Z.Q. Tian, Spectrochim. Acta A, 53, 1595 (1997).
- S. Zou, M. J. Weaver, X.Q. Li, B. Ren, Z.Q. Tian, J. Phys. Chem. B, 103, 4218 (1999).
- P. G. Cao, J. L. Yao, B. Ren, B.W. Mao, R.A. Gu, Z.Q. Tian, Chem. Phys. Lett., 316, 1 (2000).
- J. Gersten, A. Nitzan, J. Chem. Phys. 73, 3023 (1980).
- R.G. Greenler, Surf. Sci., 69, 647 (1977).
- R.G. Greenler, D.R. Snider, D. Witt, R.S. Olson, Surf. Sci., 118, 415 (1982).
- H. A. Pearce, H. Sheppard, Surf. Sci., 59, 205 (1976)
- M. Moskovits, J. Chem. Phys., 77, 4408 (1982).
- M. Moskovits, J.S. Suh, J. Phys. Chem., 88, 1293 (1984).
- N.V. Richardson, J.K. Sass, Chem. Phys. Lett., 62, 267 (1979).
- J.C. BertoLini, J. Rousseau, Surf. Sci., 89, 467 (1979).
- X. Gao, J.P. Davies, M. J. Weaver, J. Phys. Chem., 94, 6858 (1990).
- V. M. Hallmark, A. Campion, J. Chem Phys., 84, 2993 (1985).
- P. Gao, M.J. Weaver, J. Phys. Chem., 89, 5040 (1985).
- M. Moskovits, D.P. DiLella, K.J. Maynard, Langmuir, 4, 67 (1988).
- S.S. Perry, S.R. Hatch, A. Compaion, J. Chem. Phys., 104, 6856(1996)
REF: D.Y. Wu, B. Ren and Z.Q. Tian, Int. J. Vib. Spect., [www.irdg.org/ijvs] 4, 2, 10 (2000)