The use of DRIFTS to analyse binary mixtures of two polymorphic forms of ranitidine-HCl using only one specific peak
CONTRIBUTED ARTICLE
5. The use of DRIFTS to analyse binary mixtures of two polymorphic forms of ranitidine-HCl
using only one specific peak
G. Sertsou, S. Agatonovic-Kustrin, T. Rades*
School of Pharmacy,
PO Box 913,
University of Otago,
Dunedin, New Zealand
* to whom correspondence should be addressed
Email:thomas.rades [at] stonebow.otago.ac.nz
Abstract
A diffuse reflectance infrared Fourier transform spectroscopy (DRIFTS) method was developed to determine the composition of two crystalline forms of the drug ranitidine-HCl in a binary mixture. Using a peak specific to the form 1 polymorph in the DRIFT spectrum, occurring at 1352 cm-1, binary mixtures of ranitidine-HCl form 1 and form 2 were analyzed, and a standard curve for the concentration of the form 1 polymorph was constructed.
A minimum quantifiable level (MQL) of 20.4 %, and limit of detection (LD) of 6.1 % were calculated for form 1 of ranitidine-HCl. These results are compared to a solid state assay based on an artificial neural network methodology, developed earlier by Agatonovic-Kustrin et al [1]. The MQL and LD found using ANN analysis were 7.9 % and 2.4 % w/w respectively, indicating that the selection of just one specific peak for the quantification of a polymorphic form is not as precise as the ANN-approach utilising pattern recognition. However, identification and (within limits) quantification of the polymorphs based on the simple analysis of a single peak using DRIFT is possible and represents a simple and easily available alternative to the commonly used X-ray powder diffractometric analyses.
Introduction
The polymorphic behaviour of organic solids can be of crucial importance in the pharmaceutical industry. Properties varying between polymorphs include stability, crystal shape, compressibility, density, and dissolution rate. It is thus vital to control crystallisation of drugs and to ensure the approved polymorph is present in the formulation.
Ranitidine-HCl is a frequently used anti-ulcer drug. It exists as two crystalline polymorphs, known as form 1 (mp: 134 – 140 °C) and form 2 (mp: 140 – 144 °C), and in several pseudopolymorphic forms [2,3]. Form 1 is crystallised from an ethanolic solution after addition of ethyl acetate. Form 2 is crystallised from isopropanol. A technique, which can quantify each polymorphic form in a mixture, is necessary, as the polymorphic form of the drug in a formulation needs to be specified, due to possible differences in the pharmaceutical, and possibly biopharmaceutical properties of the formulation. Agatonovic-Kustrin et al [1], have used the entire low-resolution diffuse reflectance infrared Fourier transform (DRIFT) spectrum of the two forms of ranitidine-HCl to analyse polymorphic purity of the drug, modelling all peaks simultaneously with the help of an artificial neural network. In the present study, we investigated the use of DRIFTS to analyse the polymorphic purity of crystalline ranitidine-HCl using only one form 1specific peak in the DRIFT spectrum, occurring at 1352 cm-1.
Materials and Method
Ranitidine-HCl form 1 and form 2 were ground to a fine powder. 100 mg binary mixtures of 0, 5, 10, 20, 30, 40, 50, 60, 70, 80, 90, and 100 % (w/w) form 1 in form 2, were added to 1900 mg of finely ground IR grade KBr. All samples were prepared in duplicate except for the mixture containing 5% (w/w) of Form 1 in Form 2 that was prepared five times for repeatability estimations. Mixtures with 0, 5, 10, 30, 50, 70 and 100% of Form 1 were used for calibration and mixture with 20, 40 and 60% of Form 1 as a validation data set.
Analysis of samples was carried out on a dynamic alignment FT-IR spectrophotometer, extended range KBr beam splitter, DTGS detector and mid-IR ceramic source (Bio-Rad FTS 175C, Bio-Rad Laboratories, Cambridge, USA), fitted with a diffuse reflectance accessory (Pike Technology Easidiff). Spectra were captured using PC and Win-IR software. 16 scans were averaged per sample, after a KBr background was scanned. Reflectance data was transformed into Kubelka-Munk function units (F(R¥ )) using Win-IR software.
Sample mixtures were placed in the large sample cup holders of the spectrophotometer, and tapped gently on the bench to flatten out the sample, then a razor blade was used to smooth the sample surface.
Results
Common methods of building linear calibration models are multiple linear regression (MLR), principal components regression (PCR) and partial least-squares (PLS). Another approach is to select significant peaks and specify a linear function for each peak to be regressed.
As can be seen in Figure1, spectra from pure forms of each polymorph are very similar.
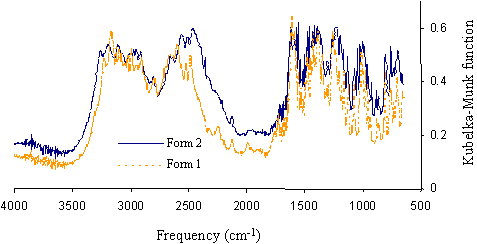
Figure 1. DRIFT spectra of ranitidine-HCl polymorphs form 1 and form 2.
A peak, which occurs only for the type 1 polymorph (Figure 2), was identified, occurring at 1352 cm1.
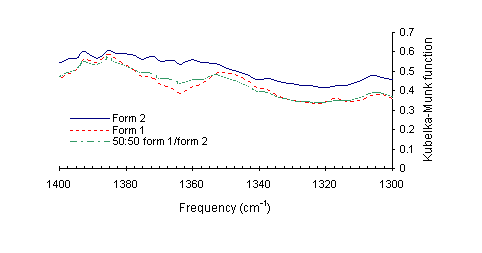
Figure 2. DRIFT spectra of the finger print region of ranitidine-HCl polymorphs form 1, form 2 and a mixture of form 1 and 2 (1:1).
The Kubelka-Munk function at (1352.4 cm-1 – 1360.1 cm-1), was used to create a calibration curve for the form 1 polymorph (Figure 3). The level of Form 1 was varied over the range of 0-100%. The absence of polymorphic transition has been evident from the closeness of the predicted composition of the mixtures and the true values calculated from the masses of the crystal forms in mixtures. At the same time they were indicative of the good accuracy of the method. The R2value of 0.97 indicates reasonable correlation of Kubelka-Munk function and concentration, in the concentration range used.
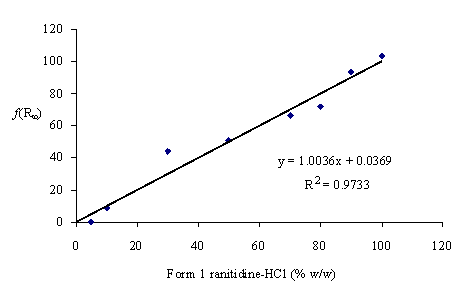
Figure 3. Kubelka-Munk function units versus form 1 ranitidine-HCl.
The regression equation in Figure 3 was used to predict the concentration of form1 ranitidine-HCl in binary mixtures containing 20, 40 and 60% (w/w) of Form 1 (Table 2), and these values are plotted against known concentrations of form 1 in Figure 4.
|
Peak height |
Measured % |
Predicted |
ValidationERR(%) |
|
0.002 |
20.0 |
23.7 |
18.3 |
|
0.016 |
40.0 |
39.8 |
0.56 |
|
0.043 |
60.0 |
69.8 |
0.16 |
|
Average ERR (%) |
6.35 |
![]()
Table 2. Predicted concentrations (%) of Form 1
Figure 4. Predicted concentration of form 1 ranitidine–HCl in binary mixtures of the two polymorphs vs. known concentration of form 1.
In a binary mixture, the balance percentage to 100% gives the concentration of the form 2 polymorph [100 – (% form 1)].
The minimum quantifiable level (MQL) [4,5], is determined from multiple measurements of the spectral response of a single sample mixture containing 5% of form 1 (n = 5) and utilizing Eq. (1).
![]() (1)
(1)
Based upon a standard deviation of 2.01 and a slope of 0.984, an MQL of 20.4 % for the form 1 polymorph was calculated. The limit of detection (LD [4,5]) was calculated by multiplying the standard deviation by three, and then dividing by the slope of the calibration curve (Eq. 2).
![]() (2)
(2)
Through this method of calculation, the LD was found to be 6.1 %.
Discussion
Linear regression of known composition of a binary mixture of form 1 and 2 ranitidine-HCl polymorphs against predicted values based on a quantitative DRIFTS analysis using a form 1 specific peak, gave a slope of 0.984, an intercept value of 0.05, and a correlation coefficient of 0.964. The intercept is not significantly different from 0, and the slope is not significantly different from 1 (a = 0.05), indicating no method bias, and no proportional error.
The calculated MQL indicates that analysis using only one peak for quantification, offers a quantifiable range only from 20 to 100 % of form 1 ranitidine-HCl, in 5% ranitidine-HCl in KBr. A more precise method of analysis of ranitidine-HCl polymorphs, involves using artificial neural networks (ANNs), as has been performed by Agatanovic-Kustrin et al [1]. In this method of spectral analysis, 173 spectral intensities were used as inputs in an ANN network, which employed pattern recognition on the entire low-resolution spectrum. The MQL and LD found using ANN analysis were 7.9 % and 2.4 % w/w respectively, for the form 2 polymorph. For quantification, using noisy DRIFT spectra such as those of ranitidine-HCl, it can be seen that spectral analysis using ANN is more precise and repeatable than using single peak analysis. However, identification and (within limits) quantification of the polymorphs based on the simple analysis of a single peak using DRIFT, is possible and represents a simple and easily available alternative to commonly used X-ray powder diffractometric analyses.
References
-
Agatonovic-Kustrin S, Tucker IG, Schmierer D. Solid state assay of Ranitidine-Hydrochloride as a bulk drug and as active ingredient in tablets using DRIFT spectroscopy with ANNs. Pharm. Res. 16 (9): 1479-1484 (1999).
-
Madan T, Kakkar AP. Preparation and characterisation of rantidine-HCl crystals. Drug Develop. Ind. Pharm. 20 (9): 1571-1588 (1994)
-
Forster A, Gordon K, Schmierer D, Soper N, Wu V, Rades T. Characterisation of two polymorphic forms of ranitidine-HCl. Int. J. Vibrational Spectroscopy 2 (2): 12 (1998)
- Robinson KA, Chemical Analysis, Little, Brown and Company, Boston, pp. 754-758, 1986.
- U.S. Pharmacopeia 23, United States Pharmacopeial Convention, Inc., pp. 1983, (1994).
Received 20th October 1999, received in revised format 11th November,
accepted 11th November 1999
REF: G. Sertsou, S. Agatonovic-Kustrin, T. Rades, Int. J. Vib. Spect., [www.irdg.org/ijvs] 3, 5, 5 (1999)