A database of inelastic neutron scattering spectra

Stewart F. Parkera and David J. Championb
aISIS Facility,
Rutherford Appleton Laboratory,
Chilton, Didcot,
Oxon OX11 0QX,
U.K.
bH H Wills Physics Laboratory,
University of Bristol,
Tyndall Avenue,
Bristol, BS8 1TL,
U.K.
Introduction
Neutron scattering experiments are expensive. Thus it is incumbent upon the users of such facilities that the best possible use is made of the data. Usually, the data is analysed, published and (hopefully) archived by the experimentalist and co-workers. At this stage the data can be considered to be “lost” to the wider scientific community, since only the published material is available. While many facilities archive the raw data from the instruments, this is not always readily available or in a user-friendly form. A notable exception is the Institut Laue Langevin (ILL) that makes all of its data available as ASCII files via the WorldWideWeb [1].
This situation may be contrasted with the practice in analytical chemistry. There, it is recognised that considerable effort is devoted to the acquisition of spectroscopic data and that once the initial purpose has been served, such as identification or characterisation of a material, the data is still valuable. Most such companies hold spectroscopic data in a database both for legal requirements and as a resource in its own right. Spectroscopic databases have also been created as commercial enterprises. The result is that the major forms of analytical spectroscopy have spectral libraries of enormous size. For instance, the Sadtler library of infrared spectra has over 150,000 compounds, whilst mass spectroscopy libraries contain over 400,000 compounds. Such libraries greatly increase the power of the techniques.
The inelastic neutron scattering (INS) spectrometer TFXA [2] at ISIS and its successor TOSCA [3] span the energy range 0 – 4000 cm-1 (0 – 500 meV), the traditional mid-infrared. The instruments are unusual among INS spectrometers in that they follow a single trajectory through momentum transfer (Q, Å-1) energy transfer (w , cm-1) space [4]. The resulting spectra are complementary to conventional infrared and Raman spectra. (TFXA and the relation of INS spectra to infrared and Raman spectra are described in an IJVS article [2]).
During the time that it was operating (May 1985 -February 1998) TFXA recorded 4499 spectra from a huge variety of materials. These included biological materials [5], catalysts [6], fullerenes [7], superconductors [8], hydrogen-in-metal systems [9], polymers [10], organic [11], inorganic [12] and organometallic compounds [13]. (The references are selected examples, a complete list of publications can be found at http://www.isis.rl.ac.uk/CrystalAnalysers/TFXApubs.htm). As a first step to increase access to the spectra we have created a small database from the spectra. The spectra selected for the database are well-characterised, pure compounds, recorded at low temperature (generally below 30K). In the remainder of this paper, we describe the philosophy adopted, how to access the database and how the database will be further extended.
The Philosophy
At an early stage it was recognised that the provision of data to potentially anyone on the planet was a sensitive issue. To overcome this problem, a twofold strategy was adopted. The only data that would be included were spectra for which the originators had given permission and those that had already been published and were thus in the public domain. In the latter case it is at least conceivable that anyone who wanted the data could digitise the spectra in the original publications and so obtain it. Every spectrum is labelled with either the originators name or the full literature citation.
The units of energy transfer were chosen to be wavenumbers (cm-1) since this is the most commonly used unit for this spectral region. It also emphasises the partnership with infrared and Raman spectra. Conversion to other units is trivial since the transformations are linear (e.g. 1 cm-1 = 0.12397 meV = 0.02997 THz).
Initially it was also decided to restrict the spectra to “parent” compounds, isotopomers would not be included. The reason for this is that it is very difficult to obtain 100% labelled materials and the presence of an isotopic impurity can have dramatic effects on the spectra. This is particularly marked in the case of deuterium for hydrogen substitution, the difference in incoherent cross-section (D 5 barns, H 80 barns) means that a few percent of H in a nominally 100% D labelled compound will give impurity features of comparable intensity to the fully labelled material, as shown in Figure 1.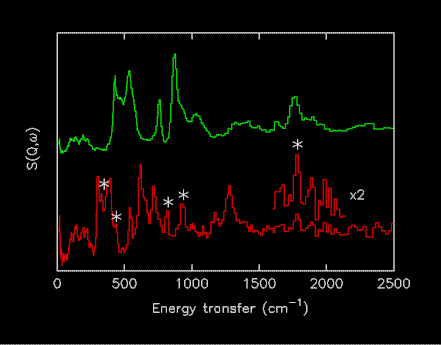
Figure 1.Comparison of INS spectra of Mg2CoH5 (upper) and Mg2CoD5 (lower). The peaks marked with * are due to the presence of a few percent of the isotopomers ax- and eq-Mg2CoHD4 [14].
It was also decided to exclude spectra of the compounds adsorbed on catalysts, since the spectra may be very different from the parent compounds. Figure 2 shows a comparison of solid formic acid and the difference spectrum of formic acid adsorbed on CuO, the features in the later are due to adsorbed formate [15]. For the future, it is planned to address both of these issues.
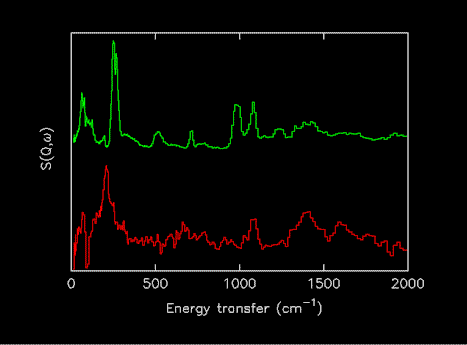
Figure 2.Comparison of INS spectra of formic acid as a solid (upper) and after adsorption on CuO (lower). (The reason for the difference is that the formic acid has reacted to generate an adsorbed formate species [15]).
The Database
The database is located at: http://www.isis.rl.ac.uk/INSdatabase/
There is a search facility which operates on the chemical name and the formula. This brings up a list of hits at the bottom of the page, clicking on the desired one will bring up the reference and a “thumbnail” sized GIF image. Clicking on the spectrum will give a full-screen image. Four file formats are available, two graphical and two ASCII versions and all of the spectra can be downloaded in all of the formats.
GIF: suitable for most graphics programs and web browsers
EMF: suitable for putting into Word or Powerpoint documents
DAT: ASCII suitable for Excel (and other spreadsheets) and CLIMAX
JCAMP-DX: the standard ASCII format for infrared and Raman spectroscopy
GIF
This is the standard Internet graphics file. It can be viewed by nearly all web browsers and by most graphics software. It can be placed into any Microsoft Office document and scaled accordingly. The title contains the chemical name or formula, the name and affiliation of the principle investigator (this is not necessarily the person who actually measured the spectrum) and a reference if it has been published. An example is shown in Figure 3.
Figure 3.INS spectrum of anthracene as a GIF file.
EMF
This a standard Microsoft Office graphics file. It can be scaled without loosing resolution, unlike a GIF. The colours can be easily changed using the graphics editor in the Microsoft Office programs. As with the GIF file the title contains the chemical name or formula, the name and affiliation of the principle investigator and a reference if it has been published.
DAT
This type of file can be imported directly into a spreadsheet or other graphical display package. It is also suitable for use with the INS spectral analysis program CLIMAX [16,17]. It is a simple (x,y,e) ASCII format with a file header:
| ACETONITRILE Ref: J.CS. Farad.Trans. 87 (1991) 539. J.W.White, ANU, Canberra, Australia
C (CM-1) COUNTS ERROR |
The first line is the name of the compound, its principal investigator, their affiliation and the literature reference (if known). The second line defines the units, for the energy transfer (i.e. x) axis all the spectra are given in units of wavenumbers, cm-1. The counts (i.e. y) column is the scattered intensity and is directly proportional to the scattering function S(Q,w ). The error column (i.e. z) is given by the square root of the number of counts, since Poisson statistics apply to the measurement process.
JCAMP-DX
This is the International Union of Pure and Applied Chemists (IUPAC) standard format for the interchange of vibrational spectra [18,19]. This format allows INS spectra to be loaded into an infrared or Raman spectrometer for direct comparison with optical data.
An example is shown below. Lines beginning with ## are comment lines. The first five lines define the origin of the spectrum, the next 12 give information as to how the data is organised, the data then follows and is terminated by ##END=.
| TITLE= Copper formate ref:J.Chem.Soc.Faraday.Trans 93 (1997) 2569-2577 P.C.H.Mitchell, University of Reading ##JCAMP-DX= 4.24 ##DATA TYPE= INELASTIC NEUTRON SCATTERING ##ORIGIN= TFXA, ISIS ##OWNER= ##NPOINTS= 996 ##XUNITS= 1/CM ##YUNITS= S(Q,w) ##RESOLUTION= ##FIRSTX= 1.600000E+01 ##LASTX= 3.996000E+03 ##XFACTOR= 1.0 ##YFACTOR= 2.027835E+06 ##FIRSTY= 6.883899E-01 ##MAXY= 5.185178E+00 ##MINY= 4.931368E-01 ##XYDATA= (X++(Y..Y)) 16.000 001395941 001055813 001000000 001110662 001281299 001535087 40.000 001912739 002303294 002639247 003124483 003366158 003506463 64.000 003527803 003330772 003643439 003699664 003751660 003409445 88.000 004229072 004171009 003863634 003682591 003906787 003691139 . . . 3952.000 002525898 002524602 002524602 002524602 002524602 002388336
3976.000 002384646 002384646 002384646 002385318 002463903 002463903 |
Conclusions
At present there are 70 materials available on the database in all four formats. It is planned to increase this during the summer of 1999 and in the longer term it is intended that as work on TFXA and TOSCA is published, the INS spectra will be made available on the website. To our knowledge this is the first time that INS data have been made readily accessible, the hope is that it will bring the advantages of INS spectroscopy to the wider community.
The Rutherford Appleton Laboratory is thanked for access to neutron beam facilities.
References
- http://barns.ill.fr/
- S. F. Parker, Internet J. Vib. Spec.[www.irdg.org/ijvs]2, 1, (1998).
- S. F. Parker, C. J. Carlile, T. Pike, J. Tomkinson, R. J. Newport, C. Andreani, F. P. Ricci, F. Sachetti and M. Zoppi, Physica B 241-243, 154 (1998).
- H D Middendorf, R L Hayward, S F Parker, J Bradshaw and A Miller
Biophysical J. 69 (1995) 660. - H. Jobic, Internet J. Vib. Spec. [www.irdg.org/ijvs] 2, 1 (1998).
- K Prassides, H. W. Kroto, R. Taylor, D. R. M. Walton, W. I. F. David, J. Tomkinson, M. J. Rosseinsky, D. W. Murphy and R. C. Haddon, Carbon 30 (1992) 1277.
- M. A. Green, M. Dalton, K. Prassides, P. Day and D. A. Neumann, J Phys:Condens Matter 9 (1997) 10855.
- D K Ross, Hydrogen in Metals III: Properties and Applications (Topics in Applied Physics. Vol. 73) (ed. H. Wipf), Springer-Verlag, Berlin, 1997, 153.
- B. Gabrys, D. Huang, F. Nardi, D. G. Peiffer and J. Tomkinson, Macromolecules26 (1993) 2007.
- P. W. Loeffen, R. F. Pettifer, F. Fillaux and G. J. Kearley, J. Chem. Phys. 103(1995) 8444.
- A. Pavese, G. Artioli and O. Moze, European J. Mineralogy 10 (1998) 59-69.
- S. F. Parker, P. H. Dallin, B. T. Keiller, C. E. Anson and U. A. Jayasooriya, Physical Chemistry Chemical Physics, in press.
- S. F. Parker, J. C. Sprunt, U. A. Jayasooriya, M. Bortz and K. Yvon, J. Chem. Soc. Faraday Trans. 94 (1998) 2595.
- S. Poulston, R. P. Holroyd, M. Bowker, S. F. Parker and P. C. H. Mitchell, Surface Science 402/404 (1998) 599.
- G. J. Kearley, Spec. Acta, 1992, 48A, 349.
- G. J. Kearley, Nucl. Inst. and Meth. in Phys. Res. A 354, 53 (1995).
- R. S. McDonald and P. R. Wilks Jr., Applied Spectroscopy 42, 151 (1988).
- J. G. Grasselli, Pure and Applied Chemistry 63, 1781 (1991).
*Please send correspondence and proofs to:
Dr S. F. Parker,
ISIS Facility,
Rutherford Appleton Laboratory,
Chilton, Didcot,
Oxon OX11 0QX
U.K.
Fax: UK-1235-445720
E-mail: sfp [at] isise.rl.acuk