The Use of Raman Mapping to Determine the Subcellular Distribution of Zinc Phthalocyanines
1T L Freeman, 1S E Cope, 1M R Stringer,
2J E Cruse-Sawyer, 3S B Brown,
4D N Batchelder, 5K Birbeck
1Research School of Medicine: Medical Physics,
2Skin Research Centre, Microbiology,
3Department of Biochemistry and Molecular Biology,
4Department of Physics and Astronomy,
5Department ofPathology
The University of Leeds,
Leeds LS1 2EX,
UK.
Centre for Photobiology and Photodynamic Therapy
Abstract
Photodynamic therapy (PDT) is a developing method for the treatment of cancer, relying upon the activation of a photosensitive drug by light, in order to selectively destroy target tissue. Raman spectroscopic mapping has been used to examine two zinc phthalocyanine derivatives, potentially of use as PDT sensitizers, to determine their localization within two cultured cell lines. EAhy 926 and Rif-1 cells were incubated with the phthalocyanines for various durations, and formalin fixed before examination. Raman spectra were recorded at 1 to 2 mm steps across the cells, using 782 nm excitation light in order to avoid absorption by the phthalocyanines. Maps have been formed showing the distribution of the phthalocyanines in each cell line for the various incubation times. The localization of the photosensitizer within the cell influences the efficacy of the PDT process, and the investigation of this is, therefore, an important factor in the development of new drugs. Preliminary results obtained from living cells are also discussed.
Introduction
Photodynamic therapy (PDT) is a developing method of cancer treatment that has been used clinically for the eradication or control of various types of cancer.[1-3] The treatment involves administration of a photosensitive drug to the patient and after a suitable time period, to allow the drug to accumulate within tumour, the site is irradiated with light, usually from a laser. This causes excitation of the sensitizer, resulting in the formation of highly reactive singlet oxygen, which ultimately causes tumour necrosis.
For a photosensitizer to be considered as suitable for use in PDT it must meet several criteria. The sensitizer must absorb strongly at a wavelength that penetrates adequately into tissue (i.e. red or near infrared). The molecule should have a large triplet quantum yield and a long triplet lifetime, allowing efficient singlet oxygen production. It is also preferable that the sensitizer achieves a high degree of selectivity between tumour and surrounding normal tissue, and is rapidly cleared from the body in order to reduce possible skin photosensitivity. It must also be completely non-toxic in the absence of light. Currently, the most commonly used sensitizer is a variant of haematoporphyrin derivative, or its commercial form Photofrin™.[4-7] However, this compound only partially fulfils the above requirements and new sensitizers are being developed and tested. A promising new class of compounds are the phthalocyanines.[8,9] The phthalocyanines demonstrate a much stronger absorption of red light than Photofrin, and the absorption band is red shifted, allowing more effective light penetration into tissue. The zinc-substituted phthalocyanines have a long triplet lifetime and high triplet yield making them suitable for use as PDT sensitizers. Early clinical investigations using phthalocyanines are also being performed.[10,11]
It is evident that the subcellular localization of a sensitizer affects the efficacy of the photodynamic process.[12] Furthermore, the range of reactivity of singlet oxygen in cells is only about 0.1 mm, implying that cell damage occurs at the site of photosensitizer localization.[13] Sensitizers located within membranes, for example, are reported to cause more damage than those found within the cytoplasm.[14] Therefore, subcellular localization studies may be critical in the development of new sensitizers. To date, investigation of intracellular sensitizer distribution has routinely been performed using fluorescence microscopy. Several groups have examined the uptake of aluminium and zinc metallated phthalocyanines in this way.[15-17] However, the study of photosensitizers by fluorescence demands the use of an excitation wavelength that will unavoidably induce photodynamic activity. There is, therefore, a risk that the method of analysis itself may alter the system under examination. Raman spectroscopy is advantageous in that a probe wavelength can be chosen that is not absorbed by the sensitizer chromophore. This article describes the use of Raman spectroscopy to examine the distribution of zinc pyridinium phthalocyanine (ZnPPc) and zinc tetra-sulphonated phthalocyanine (ZnTSPc) within two cultured cell lines. The long wavelength absorption bands of the phthalocyanines are at 675 nm and 665 nm for ZnTSPc and ZnPPc respectively. The Raman analysis is performed using a 782 nm laser, resulting in minimal absorption by the sensitizers.
Experimental
Human endothelial hybridoma (EAhy 926) and radiation-induced fibrosarcoma (RIF-1) cells were cultured upon gold coated glass cover slips. Standard nutritional medium was used (Dulbecco modified Eagles medium and 10% donor calf serum) except that phenol red was not included, to reduce background fluorescence. The cells were then incubated in medium containing solutions of zinc phthalocyanine tetrasulphonic acid tetra-sodium salt (ZnTSPc) or bis-methylene-pyridinium zinc phthalocyanine (ZnPPc), at concentrations of 20 mg/ml and 30 mg/ml respectively. The phthalocyanines were synthesized in the Department of Colour Chemistry, University of Leeds, UK.[18] Incubation times ranged from 60 seconds to 24 hours, after which the cells were fixed in 3% formalin and air-dried. Cells to be examined live were removed from their incubation media, rinsed in PBS and examined immediately. A small layer of PBS remained on the slide to prevent drying.
Raman microscopy was performed using a System 1000 CCD spectrometer (Renishaw plc, Gloucestershire, UK) coupled to an Olympus BH-2 microscope, using a 782 nm diode laser as the excitation source. Due to the large background (fluorescence) signal from cell constituents, direct Raman imaging of the sensitizer within the cell was not possible. Instead, the cells were mapped using a motorized x-y stage to scan individual cells, collecting Raman spectra at each point. Spectra were recorded from 2 mm diameter focal spots at steps of 1 to 2 mm; a x50 objective was used, with a laser power of approximately 6 mW at the sample. Exposure times of 150 or 200 seconds were used for each spectrum. Each raw spectrum was then subjected to a curve-fitting routine (Grams 32, Galactic Industries, Salem, USA), and maps were formed showing the intensity of a specific Raman peak at each point. The maps were then normalized to account for inhomogenous cell thickness, as described within the results section. Atomic force microscopy (AFM) measurements were performed using a Topometrix explorer in order to establish a map of cell thickness.
Results
Raman spectra were initially recorded from crystalline samples of the two phthalocyanine derivatives, and then from fixed cells, both before and after sensitizer incubation. This enabled assignment of Raman peaks from the sensitizers and those due to the cell itself. Figure 1 shows the structure of the phthalocyanine derivatives.
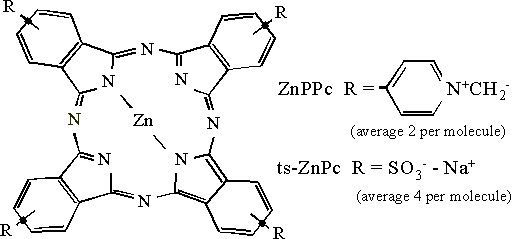
Figure 1. The molecular structure of ZnPPc and ZnTSPc
Figure 2a shows the Raman spectrum observed from a crystal of ZnTSPc. This exhibits a large peak at approximately 745 cm-1, due to the stretching vibration of the macrocycle ring.[19] This peak was also seen in the ZnPPc spectra. The spectrum from an EAhy 926 cell is shown in Figure 2b. A strong peak is observed at 1002 cm-1, assigned to an aromatic CC stretching vibration from endogenous cell components. The spectrum recorded from a Rif-1 cell was very similar to that from an EAhy 926 cell, also exhibiting a prominent peak at 1002 cm-1. Figure 2c presents the Raman spectrum from an EAhy 926 cell incubated with ZnPPc; both the 745 cm-1 and the 1002 cm-1 peaks are clearly visible. The Raman peaks observed at 745 cm-1 and 1002 cm-1 are subsequently used in the map formation.
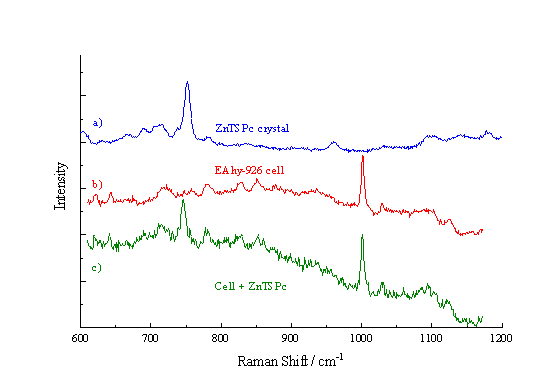
Figure 2. Raman spectra of a) ZnTSPc crystals, b) an EAhy 926 cell and c) a cell incubated with ZnTSPc.
Map Formation
To form maps of sensitizer distribution, the spectra recorded at each point upon the cell are subject to a curve fitting routine, in order to quantify the intensities of the 747 cm-1 and 1002 cm-1 peaks. The intensity of the 747 cm-1 peak is used to form a false-colour pixel map, as shown in Figure 3a. Figure 3b presents a white light image of the same cell.
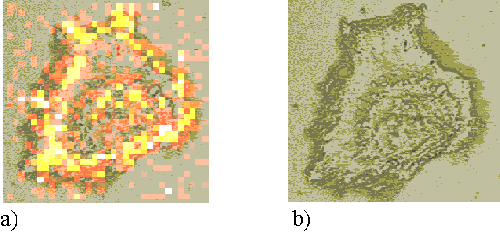
Figure 3. a) The intensity map of the 745 cm-1 Raman peak. b) A white light image of the cell mapped in figure 3a.
This map is directly indicative of sensitizer distribution. However, the peak intensity will also be affected by the volume of cell sampled. The cells are not homogenous, but are thicker in the nuclear regions than around the periphery. This increased sampling volume causes an increase in Raman signal and a falsely enhanced measure of sensitizer concentration in these regions. In order to account for this effect, a second map is formed for each cell, showing the distribution of the 1002 cm-1 peak (Figure 4a). The numerical values of the 745 cm-1 map are then divided by those of the 1002 cm-1 map to form a resultant map which is representative of sensitizer distribution (Figure 4b).
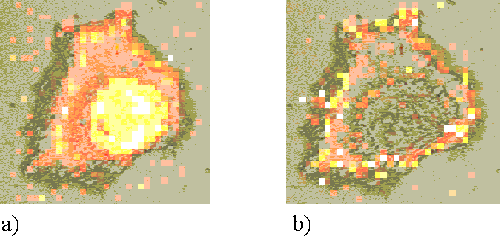
Figure 4. a) The intensity map of the 1002 cm-1 Raman peak. b) The 745 cm-1 map divided by the 1002 cm-1map.
Atomic force microscopy (AFM) has been used to establish a linear relationship between the 1002 cm-1 peak and the cell thickness.[20] AFM was used to measure the height profile of four cells that had previously been subjected to Raman mapping. The cell heights were seen to vary between approximately one micron in the nuclear regions to 200 nm at the cell edge. It was confirmed that the height of the cell was linearly proportional to the intensity of the 1002 cm-1 Raman peak. Thus the technique described above is shown to be a valid method to compensate for inhomogenous cell thickness.
Phthalocyanine Distribution Maps
A total of 91 cells have been examined. The next section describes the maps formed at different incubation times for the various cell-sensitizer combinations; a typical example of each type is shown. Figures show (a) the white light image of each cell, (b) the ratio map, and (c) the 1002 cm-1 cell peak map.
ZnTSPc
EAhy 926 cells were incubated with ZnTSPc; after approximately one hour the sensitizer can be observed within the cell (no sensitizer is recorded at shorter incubation times).
Figure 5 shows an EAhy 926 cell incubated with ZnTSPc for 1 hour; the sensitizer is located around the edge of the cell, probably bound to the plasma membrane.

Figure 5. EAhy 926 cell incubated with ZnTSPc for 1 hour.
At larger incubation times, the sensitizer relocates to sites within the cell. Figures 6, 7 and 8 show incubation times of 4, 6 and 24 hours respectively. At these longer incubation times the sensitizer is seen to locate in perinuclear regions, either as a perinuclear ring or in a region to the side of the nucleus. Both patterns are consistent with the sensitizer being bound to the nuclear membrane or Golgi apparatus.

Figure 6. EAhy 926 cell incubated with ZnTSPc for 4 hours.

Figure 7. EAhy 926 cell incubated with ZnTSPc for 6 hours

Figure 8. EAhy 926 cell incubated with ZnTSPc for 24 hours.
The pattern of ZnTSPc uptake was similar in the Rif-1 cells. Figure 9 shows a Rif-1 cell incubated for 5 minutes with ZnTSPc. A faint ring is observed around the edge of the cell indicating that the sensitizer is just entering the cell, and is bound to the plasma membrane. After an incubation time of 1 hour, the sensitizer is seen far more clearly around the cell edge (Figure 10). The map shown in Figure 10 appears to be slightly shifted from its corresponding cell image. Part of the mapping procedure involves aligning the crosshairs on the CCD camera image with the laser spot. It is thought that the misalignment of the map in Figure 10 is due to incorrect alignment of these crosshairs and is a software feature rather than a feature of the cell itself.

Figure 9. Rif-1 cell incubated with ZnTSPc for 5 minutes.
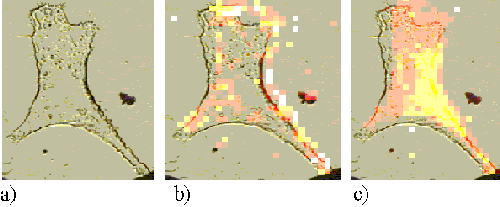
Figure 10. .Rif-1 cell incubated with ZnTSPc for 1 hour.
Figures 11, 12 and 13 show Rif-1 cells incubated with ZnTSPc for 2, 18 and 24 hours respectively. After approximately two hours, the sensitizer is located in regions near to the nucleus, and at larger incubation times a strong perinuclear ring is observed. These patterns are similar to those observed in the EAhy 926 cells, and are indicative of the sensitizer binding to the nuclear membrane or Golgi apparatus.

Figure 11. Rif-1 cell incubated with ZnTSPc for 2 hours.

Figure 12. Rif-1 cell incubated with ZnTSPc for 18 hours.

Figure 13. Rif-1 cell incubated with ZnTSPc for 24 hours.
ZnPPc
Figure 14 shows an EAhy 926 cell incubated for 1 minute with ZnPPc. At this short incubation time a strong ring of sensitizer is already observed around the edge of the cell, implying plasma membrane binding. ZnPPc appears to enter the cells at a much faster rate than the ZnTSPc.
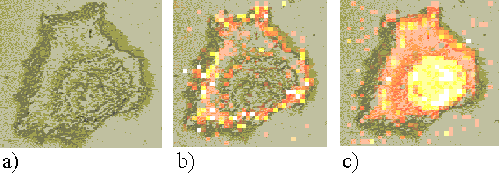
Figure 14. EAhy 926 cell incubated with ZnPPc for 1 minute.
Figures 15 and 16 show EAhy cells incubated with ZnPPc for 5 minutes and 1 hour respectively. Within an hour, the sensitizer is seen to be localizing in regions near to the nucleus.

Figure 15. EAhy 926 cell incubated with ZnPPc for 5 minutes.
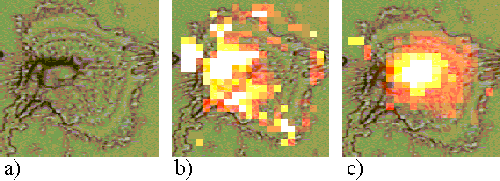
Figure 16. EAhy 926 cell incubated with ZnPPc for 1 hour.
At incubation times greater than 1 hour, a large amount of drug enters the cell, and in some cases can even be seen by eye through the microscope as blue regions. The presence of so much sensitizer induces a large fluorescence background, which saturates the CCD detector on the Raman system. This is shown in Figure 17, an EAhy 926 cell incubated for 24 hours with ZnPPc. The dark region in the centre of the bright ring (marked ¬) is the saturated region and shows no useful information.

Figure 17. EAhy 926 cell incubated with ZnPPc for 24 hours.
The Rif-1 cells also show a much faster uptake of ZnPPc than ZnTSPc. Figures 18 and 19 present Rif-1 cells incubated with ZnPPc for 5 minutes and 30 minutes respectively; in both cases the sensitizer is located at the edge of the cell. Saturation starts to occur in the cells after approximately 2 hours incubation. Figures 20 and 21 show Rif-1 cells incubated with ZnPPc for 1 and 5 hours respectively.

Figure 18. Rif-1 cell incubated with ZnPPc for 5 minutes.
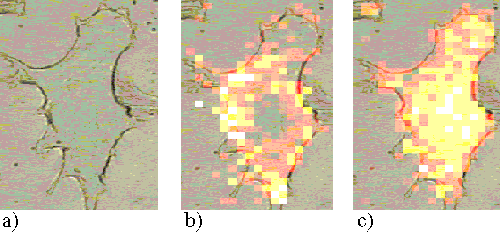
Figure 19. Rif-1 cell incubated with ZnPPc for 30 minutes.

Figure 20. Rif-1 cell incubated with ZnPPc for 1 hour.

Figure 21. Rif-1 cell incubated with ZnPPc for 5 hours.
It appears that both phthalocyanine derivatives follow the same pattern of uptake into the cells. Initially, the sensitizer is seen to be located at the periphery of the cell. It is thought that the sensitizer is binding to the cell’s plasma membrane, possibly binding to the membrane proteins, as this process is established in solution. Over longer incubation times, the drug is transported into the cell, and eventually is seen to be within the perinuclear area, although not within the nucleus itself. It is thought that the sensitizer is localizing in the Golgi apparatus or possibly within the nuclear membrane. Previous experiments using fluorescence microscopy have exhibited similar patterns of distribution.[21] Experiments examining the cellular PDT damage caused by these phthalocyanines have also shown results consistent with membrane damage.[21]
Figure 22 presents a comparison of the uptake rates of the two sensitizers within the two cell lines. The points show the maximum value of the 745 cm-1 / 1002 cm-1 ratio within each cell. Each point represents the average value of all the cells examined subject to the same experimental parameters; the error bars indicate the spread of data for each set of cells. Again, it is clear that the ZnPPc is entering the cells at a greater rate than the ZnTSPc. It is also observed that the ZnTSPc appears to accumulate to a threshold amount, and then level off. The ZnPPc on the other hand, continues to accumulate rapidly within the cell.
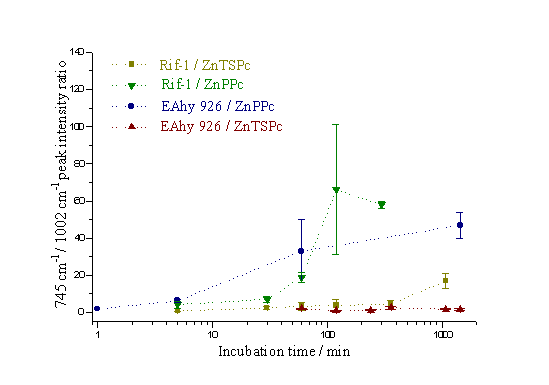
Figure 22. The ratio of the 745 cm-1 to 1002 cm-1 Raman peaks as a function of incubation time.
Live Cells
EAhy 926 cells were incubated with ZnPPc for 2.5 hours, and examined immediately following removal from the incubation medium. The microscope light used to view the cells was passed through a blue filter, allowing only a narrow band-width of light (484 – 494 nm) to reach the cells. This band was chosen as this is the region of the visible spectrum at which the phthalocyanines show minimal absorption, reducing the possibility of sensitizer relocalization within the cells. Figure 23a shows the Raman spectrum recorded from a live EAhy 926 cell before exposure to phthalocyanine. The 1002 cm-1 peak can clearly be seen. Figure 23b shows the spectrum from an EAhy 926 cell after incubation with ZnPPc. It can be seen that there are peaks due to both the cell itself (red arrows) and the phthalocyanine within the cell (blue arrows). Although the cells were cooled to 4°C to maintain their viability, they could only survive in air for approximately 20 minutes. It was not therefore possible to keep the cells alive for long enough to perform mapping. The development of an enclosed system of analysis for examining the cells in a suitable environment would enable mapping to be performed.
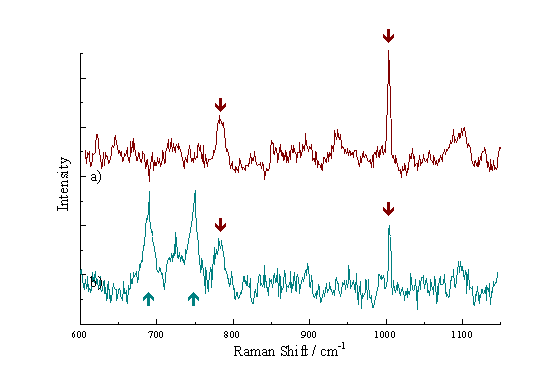
Figure 5. EAhy 926 cell incubated with ZnTSPc for 1 hour.
Conclusions
Raman mapping has been performed on two cultured cell lines, incubated with two zinc phthalocyanine derivatives, which have a potential use as photosensitizers for PDT. The phthalocyanines followed the same patterns of localization within both cell lines. However, it was noted that the ZnPPc entered the cell more rapidly than the ZnTSPc, and also accumulated to a greater extent. The differences observed between the two phthalocyanines may be a consequence of the differing charge upon the two molecules – ZnPPc is cationic, whereas ZnTSPc is anionic. This may lead to different methods of molecular uptake into the cells. Cationic molecules can diffuse across the cell’s plasma membrane, whereas anionic molecules may be hindered by the electrical potential difference across this membrane. It is also possible that the number of functional groups attached to each phthalocyanine may affect the rate of uptake. ZnTSPc has four functional groups, whilst ZnPPc has, on average, only two. In particular, when these two groups are situated adjacent to each other, the ZnPPc molecule becomes bipolar, this factor will also increase the molecule’s ability to diffuse through the membrane.
The distribution of sensitizer within the cell lines as indicated using Raman mapping is consistent with results seen using the established technique of fluorescence microscopy.[21] Although fluorescence images provide greater resolution of specific cell structures, Raman spectroscopy has the additional advantage of minimum system perturbation. It may also be possible to use Raman spectroscopy to determine changes in cellular structure upon binding with the photosensitizer, or upon photoactivation of the sensitizer.
Experiments examining living cells have shown that it may be possible to use the Raman mapping technique to study sensitizer localization within live cells. However, it will be necessary to encase the cells in a suitable atmosphere for their survival.
Acknowledgements
We thank Jack Schofield (Department of Colour Chemistry, The University of Leeds) for phthalocyanine synthesis and purification, and Dr Cora-Jean Edgell (University of North Carolina, USA) for her kind donation of the EAhy 926 cell line. We are grateful to Yorkshire Cancer Research for funding this work.
References
- B.W. Henderson and T.J. Dougherty, Photochemistry and Photobiology 55,145 (1992).
- A.J. MacRobert and D. Phillips, Chemistry and Industry 1, 17 (1992).
- J.J. Schuitmaker, P. Baas, H.L.L.M. van Leengoed, F.W. van der Meulen, W.M. Star and N. Van Zandwijk, J.Photochem.Photobiol.B:Biol. 34, 3 (1996).
- P.J. Robinson, J.A.S. Carruth and G.M. Fairris, British Journal of Dermatology 119, 59 (1988).
- A.J. Pope and S.G. Bown, British Journal of Urology 68, 1 (1991).
- K. Furuse, M. Fukuoka, H. Kato, T. Horai, K. Kubota, N. Kodama, Y. Kusunoki, N. Takifuji, T. Okunaka, C. Konaka, H. Wada and Y. Hayata, Journal of Clinical Oncology 11, 1852 (1993).
- K. Moghissi, K. Dixon, E. Hudson and M. Stringer, Lasers in Medical Science 10, 67 (1995).
- I. Rosenthal, Photochemistry and Photobiology 53, 859 (1991).
- J.Griffiths, J.E. Cruse-Sawyer, S.R. Wood, J. Schofield, S.B. Brown and B. Dixon, J.Photochem.Photobiol.B:Biol. 24, 195 (1994).
- C. Hadjur, G. Wagnieres, F. Ihringer, P. Monnier and H. Van den Bergh, J.Photochem.Photobiol.B:Biol. 38, 196 (1997).
- V.V. Sokolov, V.I. Chissov, R.I. Yakubovskya, E.I. Aristarkhova, E.V. Filonenko, T.A. Belous, G.N. Vorozhtsov, N.N. Zharkova, V.V. Smirnov and M.B. Zhitkova, Proc. SPIE 2625, 281 (1996).
- K.W. Woodburn, N.J. Vardaxis, J.S. Hill, A.H. Kaye, J.A. Reiss and D.R. Phillips, Photochemistry and Photobiology 55, 697 (1992).
- J. Moan, J.Photochem.Photobiol.B:Biol. 6, 343 (1990).
- K. Berg, J.C. Bonner and J. Moan, Photochemistry and Photobiology 49, 587 (1989).
- J. Moan, K. Berg, H. Anholt and K. Madslien, Int.J.Cancer 58, 865 (1994).
- A. Ruck, G. Beck, R. Bachor, N. Akgun, M.H. Gschwend and R. Steiner,Journal of Photochemistry and Photobiology B 36, 127 (1996).
- Q. Peng, G.W. Farrants, K. Madslien, J.C. Bommer, J. Moan, H.E. Danielsen and J.M. Nesland, Int.J.Cancer 49, 290 (1991).
- J. Griffiths, J. Schofield, M. Wainwright and S.B. Brown, Dyes and Pigments33, 65 (1997).
- R. Aroca, C. Jennings, G.J. Kovacs, R.O. Loutfy and P.S. Vincett, J.Phys.Chem. 89, 4051 (1985).
- T.L. Freeman, S.E. Cope, M.R. Stringer, J.E. Cruse-Sawyer, S.B. Brown, D.N. Batchelder and K. Birbeck, Applied Spectroscopy 52, 1257 (1998).
- J.E. Cruse-Sawyer, “Tissue and tumour response to photodynamic therapy: photosensitisers and effects on the vascular endothelium“, (Thesis, The University of Leeds, 1996).
Received 18th December 1998, received in revised format 14th January 1999,
Accepted 14th January 1999.

