Surface Raman Spectroscopy on Transition Metal Surfaces

B. Ren, J.L. Yao, C.X. She, Q.J. Huang, Z.Q. Tian
State Key Laboratory for Physical Chemistry
of Solid Surfaces and Department of Chemistry,
Xiamen University,
Xiamen 361005,
P. R. China
Email: bren [at] jingxian.xmu.edu.cn
Abstract
This paper presents various methods of preparing SERS active substrates from transition metals. They include electrochemical square potential oxidation-reduction cycle procedures, chemical etching, the nanostructured aluminum oxide template method, and the deposition of thin films coated onto SERS active gold surfaces. It is essential one must obtain SERS activity on these metals, to make Raman measurement on transition metal surfaces possible. A new method for calculating the surface enhancement factor (SEF) has been introduced based on the features special to the confocal microscopic configuration of the Raman system, and the SEFs for transition metals are shown to be around one to three orders of magnitude. Based on the highly sensitive confocal microprobe Raman spectrometer, pyrazine adsorption on a Ni surface has been used as an example to demonstrate the advantages of Raman spectroscopy, in particular the relaxation of the molecules to the surface selection rules. Thiourea adsorption on an Fe surface, an important anti-corrosion system, has been studied to demonstrate the applicability of SERS in systems of practical importance. An advantage of Raman spectroscopy is that it can be used to study very rough surfaces under vigorous reaction conditions. This is demonstrated through the electro-oxidation of methanol on roughened Pt electrode surfaces.
Introduction
As pointed out in the Editorial Article in this Special Edition of IJVS, the incredibly high enhancement typical of the SERS phenomenon [1-3] is confined to the coinage metals Cu, Ag and Au [4-6]. This greatly limits the application of SERS in electrochemistry, where the most widely used electrochemical electrode material is Pt. In electrocatalysis, anti-corrosion, and power source systems the most widely used metals are Pt, Ni and Fe. Therefore, it is of great significance to extend our surface Raman studies to transition metal surfaces in order to enable us to investigate the surface and interfacial processes.
Unfortunately, theoretical calculations show that only very low or even no surface enhancement is likely to occur at Pt and Ni as well as other transition metal surfaces [7]. The signal to noise ratio of the surface Raman signal expected for monolayer adsorbates are thus well below the detection limit of a conventional Raman spectrometer [8]. However, people never give up their efforts! In order to achieve the goal, means have been found to extend Raman spectroscopy to enable us to study a wide range of metal and non-metallic surfaces other than Ag, Cu, and Au – all within the past decade.
In the mid 1980s’, a strategy based on thin film technique was proposed, either by depositing SERS active metals onto transition metal substrates, or by depositing transition metals over SERS active substrates [9,10]. However, at that time it was very difficult to cover the substrate completely, making this approach difficult to apply although it showed great promise. A more direct procedure is to obtain Raman signals from pure transition metal surfaces, one which has been exploited by several groups doing SERS since its earliest days and includes Fleischmann’s work on CO/Pt and Bilmes’ on pyridine/Pt [11,12]. More recently, with advances in Raman instrumentation, four other groups have attempted to make more straightforward observations of normal or resonance Raman signals from adsorbates over mechanically polished Pt electrodes [13-16]. Unfortunately, in all of this research on bare Pt electrodes, the surface spectrum has to be obtained under optimal conditions or involve difference spectrum methods due to the insufficiency of the signal intensity. Indeed, signals are typically too weak to be investigated as a function of the electrode potential. Consequently, there have been no continuous reports on bare Pt electrodes in the past five years except those emanating from our group, indicating the extreme difficulty in its practical application.
In recent years, the utilization of charge coupled device (CCD) detectors, confocal microscopes, and notch filter in Raman instrumentation, have produced a new generation of Raman instruments, providing very high sensitivity, so high in fact that one can partially break the current limitation on sensitivity to surface Raman investigation. Taking advantage of these sensitive instruments, it is worth of picking out the systems which are the most important yet very difficult to study i.e. extending surface Raman investigation to transition metal surfaces, an area of the greatest significance to electrochemistry and other surface sciences, such as catalysis. The success of the approach must deepen our understanding of the SERS mechanism and develop Raman spectroscopy into a general, powerful and versatile tool for analyzing interfacial structures. In this paper, emphasis was put on the generation of SERS active transition metal substrates, including the roughening procedure for Pt, Ni and Fe. Method for obtaining SERS active nanorod arrays and the ultrathin film technique based on highly SERS active Au are also introduced. The calculation of the surface enhancement Raman factor is also given followed by some examples to demonstrate several features of Raman Spectroscopy.
Experimental
Instrument
The Raman instrument employed in this study is a new generation Raman spectrometer—Labram I confocal microprobe Raman system from Dilor (France). The microscope attachment is based on an Olympus BX40 system and uses a 50´ long working-distance objective (the working distance is 8 mm, the NA is 0.55) so that the objective need not be immersed in the electrolyte. The incident light and collection optics are coupled into a confocal configuration to increase the spatial resolution of the instrument, the system utilizes a backscattering configuration to collect the Raman signal through the microscope vertically. A holographic notch filter is used to filter the excitation line and two selected holographic gratings (1800 g/mm and 300 g/mm) are employed to disperse the Raman signal. The design is as much to meet the various requirements of spectral resolution for different types of work. Thus with the 1800 g/mm holographic grating, the spectral resolution varies between 1.5 and 3.0 cm-1 depending upon the spectral region. An air-cooled 1024´ 256 pixels CCD (Wright, England) operating in the MPP mode at -60 ºC is used as the detector. The exciting wavelengths in our system can either be 632.8 nm from an air-cooled He-Ne laser or 514.5 nm from an Ar+ laser. The laser power can be adjusted and the laser spot size is around 1~2 m m. The size of the slit and pinhole can be adjusted to meet the requirements of individual experiments.
The potential applied to cells during Raman measurements are controlled by a PAR 173 Potentiostat (EG&G). Square waves are generated by a GFG-8016G function generator (Good Will Instrument, Co. Ltd.). A large platinum ring serves as the counter electrode. The reference electrode is the saturated calomel electrode (SCE), thus all the potentials in this paper are quoted versus SCE. All solutions were prepared from analytical grade reagents and MilliQ-water.
Spectroelectrochemical setup
A spectroelectrochemical cell of appropriate design is crucially important to this type of Raman study. On the one hand, it should involve the minimum loss of signal, whilst on the other hand, it should retain the electrochemical reaction. Figure 1 shows the spectroelectrochemical cell designed for the LabRam I confocal microprobe Raman spectrometer. As has been described above, this kind of instrument utilizes a backscattering configuration to collect Raman signal through a microscope vertically. Thus, a spectroelectrochemical cell with the electrode facing upwards is essential. In this configuration, any evaporated solution, as well as products generated during the electrochemical process will contaminate the microscope objective sited above the electrode as well as the instrument itself. This may lead to the etching of the lens and in degradation of the performance of the instrument. To overcome these problems, the cell was designed with a quartz or glass cover to form a closed system. This kind of cell satisfies three functions: First, it isolates the solution from the microscope objective to prevent the etching of the objective by the solution. Secondly, it eliminates contamination of the electrochemical system by air and thirdly, with an appropriate holder, the cell is capable of standing up with the electrode surface facing horizontally or lying down with the electrode surface facing upwards. Furthermore, the cell is capable of serving as a flow cell or permitting the user to purge with gas during his experiment using a proper adapter.
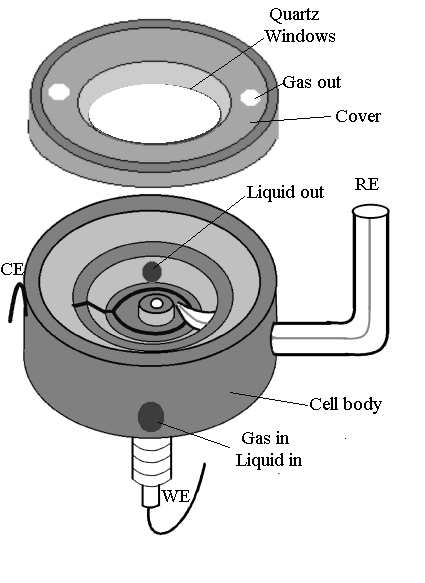
Figure 1. Spectroelectrochemical cell for confocal microprobe Raman system.
Results and Discussion
Preparing SERS active transition metal substrate
As is well known from previous SERS studies on Au, Ag and Cu, a necessary but not necessarily sufficient requirement for the presence of large surface enhancements is some form of surface roughness [4-6]. Well developed surface roughness can raise the surface Raman signal by increasing the number of adsorptive site [1]. However, different metals have very distinctive different properties, as a result, the procedures for obtaining rough surfaces for one metal will not be those suitable for another. We have examined several procedures for different transition metals to obtain surface spectra with good signal-to-noise ratio (S/N).
Surface roughening procedure for Pt electrodes
More than 10 years ago, Arvia and co-workers developed a repetitive periodic potential method to develop metal electrode surfaces with preferred crystallographic orientations and different levels of roughness [17]. Applying this method to Pt electrode surfaces, they produced electrodispersed Pt electrodes of large and controllable surface area. Later on, this kind of electrode was used as a SERS substrate by Bilmes et al for the SERS study of pyridine at a Pt electrode surface [12], although the S/N was quite poor, they successfully obtained signals from adsorbed pyridine.
Slight modifications on the method developed by Arvia have been made in our laboratory in order to obtain rough electrode surfaces of high stability and reversibility or even to generate possible surface enhancement. The detailed roughening procedure for the Pt electrode is shown in Figure 2.
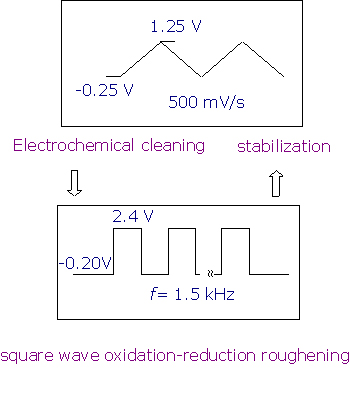
Figure 2. Roughening procedures for the Pt electrode in 0.5 M H2SO4 solution.
In brief, a mechanically polished, mirror finished Pt electrode is subject to electrochemical cleaning between -0.25 V to +1.25 V in 0.5 mol.l-1 H2SO4 until the characteristic cyclic voltammogram (CV) curve is obtained (normally after ~5 min). The solution is then replaced with fresh sulfuric acid, and the electrode is subject to square wave potential (E1=-0.20 V, E2=+2.4 V, f=0.5~2 kHz) oxidation and reduction cycles (ORCs) for from seconds to several minutes depending on the purpose behind the study. After that, the electrode potential is kept at -0.20 V to guarantee complete reduction. The electrode surface treated by this method is dark yellow to brown in colour. This surface shows very high catalytic activity as deduced from our Raman studies. In order to make a stable SERS substrate, another step has to be made by electrochemically potential cycling the freshly roughened Pt electrode between -0.25 to +1.25 V to remove all unstable particles and impurities. The colour of the electrode is then light yellow to grey depending on the different ORC and stabilization times.
The cyclic voltammogram (see Figure 3) of the roughened Pt surface contains several characteristic regions: (1) Hydrogen evolution; (2) Hydrogen adsorption and desorption; (3) A double layer region and, (4) Oxygen adsorption and desorption. Conventional electrochemical studies on this system have revealed that the charge flowing through the hydrogen adsorption or desorption region is equivalent to one monolayer of hydrogen discharge/charge on the surface, i.e., a typical value is ca. 210 m C cm-2 [18]. Measuring the charge flowing in the hydrogen region, one can calculate the surface area and hence the surface roughness factor by the following equation: – ![]()
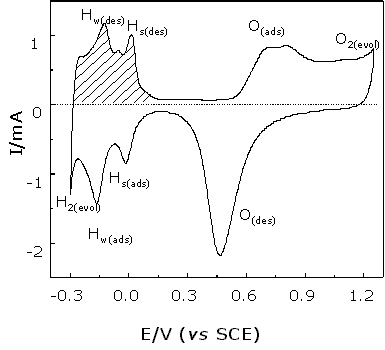
Figure 3. Cyclic voltammogram of a roughened Pt electrode in 0.5 M H2SO4 solution. Scanning rate: 50 mV/s. The geometry area of the Pt electrode is 0.1 cm2.
Although longer roughening time leads to larger surface areas, the Raman intensity is not proportional to the surface area. A very important point should be mentioned here is that Pt electrodes have to be very carefully polished, especially those that have been subjected previously to extensive roughening. Incomplete polishing will result in failure during the next round of roughening.
The STM image of a heavily roughened Pt surface (with R » 200) is given in Figure 4. It is clear that the Pt surface presents a very rough but uniform structure, and that ‘humps’ about 200 nm high are present. Increasing the magnification reveals, some fine structure of height around 10 to 20 nm over the 200 nm ‘humps’. This observation may explain the large surface area of the treated electrode.
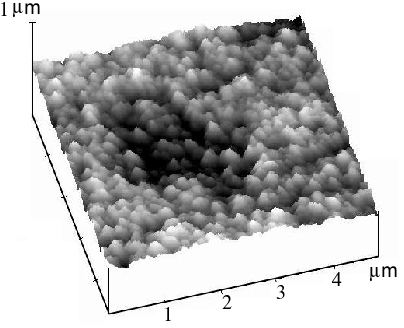
Figure 4. STM image of a Pt electrode surface after subject to electrochemically periodic roughening in sulfuric acid. Scanning range 5´ 5 m m2.
It should be noted that, this roughening procedure is quite different to that applied to typical SERS-active metals. Several problems are known to exist when roughening Ag, Cu and Au. Firstly, most of the roughening procedures involve the Cl– and the roughened surface layer obtained is normally quite loose, so much so that it can be removed by a slight touch of the fingers. The residual Cl– can have effects on the resultant spectra. Secondly, in order to obtain good SERS signals, the in-situ ORC roughening process is generally used for Ag and Cu electrodes, thus problems of irreversibility and instability in the SERS measurements are inescapable. In particular, at more negative potentials the adsorbates are completely or at least partially desorbed, leading to sharp decreases or irreversible destruction of the SERS intensity. In order to retain the SERS activity or to remove the unstable high activity SERS, PASERS or DESERS have been used, respectively [8,19].
On the other hand, Pt roughened as we describe shows excellent stability and reversibility. More interestingly, the Raman signal can be recovered completely upon returning the electrode potential to more positive values even after a very negative potential excursion. The most exciting property is that the electrode can be reused over a long time as long as it is subject to an electrochemical cleaning procedure by cycling in a H2SO4 solution before each new experiment.
A comparison between Pt and Ag electrodes after potential cycles is given in Figure 5. It is clear that the Pt electrode has very good stability and reversibility, while for the Ag electrode, the signal experiences substantial loss. Furthermore, it is found that the SERS from this surface is quite uniform. These advantages ensure that the vibrational properties of the adsorbate probed by surface Raman spectroscopy are reasonably representative of those for the entire surface rather than for just some of the SERS active sites. Accordingly, we hope that this development in surface Raman spectroscopy will prove to be of general and reliable practical applications.
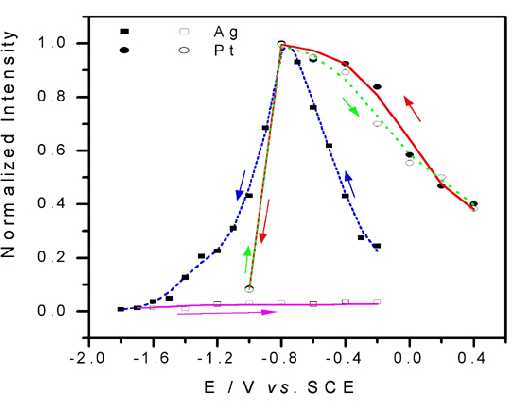
Figure 5. The integrated intensity-potential profile for ring breathing mode (~1008 cm-1) of adsorbed pyridine on Pt and Ag surfaces.
Roughening procedure for Ni electrodes
Different surface pretreatments may result in distinctly different Raman signal intensities. Figure 6 illustrates this effect by showing the Raman signal of pyridine adsorbed on to Ni electrode surfaces. The surface signal is extremely weak from the mirror-like surface [mechanically polished with fine grades of alumina powders down to 0.05 m m]. The strongest band intensity for the adsorbed pyridine is only about 0.5 cps. The spectrum is certainly too weak to be investigated as a function of potential. The S/N was improved after the electrode was chemically etched in 1.0 M HNO3 solution for 5-7 min. (7 cps in the strongest band). The surface becomes dark grey whence it is cleaned with triply distilled water. The surface roughness factor of this electrode was estimated to be 4 from capacitance measurements. The intensity increased to about 14 cps if the electrode is further treated in a 0.1 M KCl solution using a double-step oxidation-reduction cycle (ORC). An even more intense signal of 26 cps was obtained when the additional ORC was performed in situ in the spectroelectrochemical cell immediately prior to the measurement. This series of observations illustrates that a proper surface roughening procedure is crucial if one wishes to obtain reasonably good spectra for detailed investigations. It can be seen clearly that the roughening procedure for Ni is simpler than that for Pt.
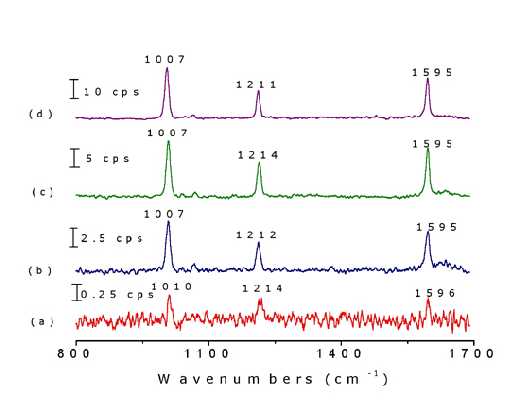
Figure 6. Raman spectra of pyridine adsorbed on nickel surfaces with different roughening procedures in a solution of 0.05 M pyridine and 0.1 M KCl: (a) mechanical polishing, (b) chemical etching in 1 M HNO3 for 5 min, (c) ex-situ ORC in 0.1 M KCl by a double-step oxidation reduction cycle (ORC) from -0.4 V to 0.4 V where the potential was held for 3 s and then returned to -0.4 V, (d) in-situ ORC in a solution of 0.05 M pyridine and 0.1 M KCl in the spectra-electrochemical cell prior to the measurement. The laser excitation line was 632.8 nm.
The roughening procedure for Fe and Co is similar but not identical to that for Ni. Slight differences in etching time, solution and ex situ pretreatments are required.
Preparing ordered SERS substrates
Although rough surfaces can be obtained by various surface pretreatments such as electrochemical oxidation-reduction cycling (ORC), and/or chemical etching, etc. The roughened surfaces are often non-uniform resulting in different enhancements within the different regions of the surface. It is very important that SERS substrates have a very narrow distribution of roughness, i.e., the particle size and shape are optimized. There are some reports in the literature describing the use of lithography to produce highly ordered periodic arrays of nanodots or nanorods. These techniques are apparently a good way to generate suitable particle sizes and shapes to generate SERS for a range of metals. However, no technique other than the template synthesis method is capable of controlling well, both the diameter and aspect ratio of nanorods (nanowires) in a large area such as a regularly structured SERS substrate.
Using this technique, our group have fabricated ordered nanorod arrays showing very good SERS-activites especially for transition metals (e.g., Ni, Co and Fe). The approach is to electrochemically deposit the desired metal into the nanopores of anodic aluminum oxide (AAO) films followed by partial removal of the oxide layer [20]. Since the SERS effect is very complex and depends critically on many factors such as the size, shape and dielectric constant of the metals [7], it is essential to carry out a systematic study to obtain the optimal condition for transition metals. The work can be particularly valuable because some transition metals are of both fundamental and practical importance.
Our study shows that five to six orders of magnitude in the enhancement for the noble metal Au, Ag and Cu and about three orders for Co and Ni nanowire arrays with appropriate lengths can be obtained [21]. These latter values are quite striking if we consider the fact that they are obtained from nanowires without applying any potential. It is further worth noting that the spectral features special to SERS, including the frequency and relative band intensity, from these nanowires are nearly identical to those of the normal bulk electrode at open circuit potential. For adsorbed pyridine over the noble and transition metal electrodes, its SERS intensity at open circuit potential is normally three to ten times weaker than that at the optimized potential. If one further uses similar experimental conditions into account (i.e., at open circuit potential), the enhancement factor for nanorod arrays is at least one order greater than that of the conventionally roughened electrodes of the same metal. This illustrates that metal nanowire arrays can serve as excellent SERS active substrates, especially for transition metals.
Furthermore, from our AFM measurements, it has been found that this kind of surface is very uniform (see Figure 7.), i.e., it is very suitable to act as an ideal SERS substrate. This strategy will be very helpful in the future enabling us to gain a deeper insight into the complicated surface enhancement mechanisms of SERS. Reproducibility of regularly structured SERS substrates over the nanometer scale is very helpful in improving the applicability of these sensitive techniques in quantitative chemical analysis and in sensors. The approach also offers us the possibility of comparing experiment with theoretical predictions.
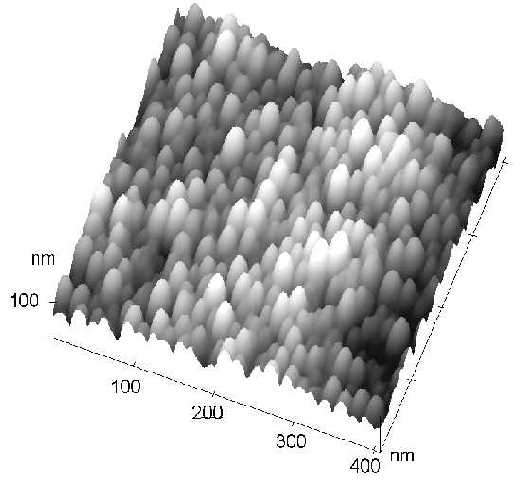
Figure 7. The AFM image of a SERS active Nickel nanorod arrays after the Al2O3 template was partially dissolved by NaOH.
Thin film strategy using the high SERS activity of the Au substrate
The thin film strategy making use of the long-range effect of SERS described above, did not prove to be a promising procedure before the 1990’s because it proved very difficult to completely cover such rough substrates with so thin a film. It proved to be almost impossible to eliminate entirely the contribution of the giant SERS of the substrate and its boundary with the overlying metal [22]. However, recently, Weaver and his coworker have revised the electrodeposition procedures for transition metal, yielding ‘pinhole free’ transition metal films over in their case the SERS active Au surface [22-24]. The films were prepared by constant current deposition at low current density, whence strong Raman signals for CO, benzene and benzonitrile have been obtained [23,24]. These platinum group overlayers enable rich vibrational spectra to be obtained for a myriad of adsorbates in both electrochemical and gaseous environments free of interference from the underlying gold substrate. The electrodeposited platinum-group overlayers also provided versatile SERS-active surfaces enabling them to explore chemisorption and catalysis in elevated temperature gas-flow reactors [22].
The high sensitivity this procedure provides makes this method highly applicable to the Raman spectra for species with very low Raman cross section and enables us to study fast surface reaction processes. However, the stability and reversibility of this kind of surface for application in electrochemistry over a wide potential range, especially for systems under rigorous reaction conditions, is still problematic. A film with a more compact structure may be of help.
Various methods exist to prepare transition metal SERS substrates of high activity and these enable us to obtain surface Raman signals from a range of transition metal surfaces. This opens up a new research field for Raman spectroscopy, one which will inevitably deepen our understanding of the SERS mechanism and the processes that occur at the transition metal surface. Before showing examples of some of these SERS studies of transition metal surfaces, a method calculation the surface enhancement factor for the confocal configuration and based on our high quality surface Raman spectra are described below.
Calculation of the surface enhanced factor (SEF) in a confocal microprobe Raman system
There is still controversy as to whether transition metals can yield weak SERS activity or not, a matter of great interest to both surface science and the Raman community. Bilmes et al. reported a SEF calculation based on the very weak signal derived from pyridine (Py) obtained from highly electrodispersed Pt electrode, and the SEF was estimated to be around 100 [12]. We, on the other hand, have proposed a method of calculation of the SEF after considering the special feature of the confocal Raman system.
In our study high quality Raman spectra of Pyridine adsorbed on the transition metal surfaces (Pt, Ni and Fe) have been obtained with our highly sensitive Raman system. Only a concise introduction is given here. As in most SEF calculations, Pyridine is employed as the model molecule and the Raman intensity of the totally symmetric vibration (n 1) is used to calculate the SEF of a Pt surface. As usual, the SEF is obtained as the ratio of the integrated intensities contributed by each molecule on the surface compared with that in the solution, respectively. Thus, the SEF can be defined as [25]:
![]() (1)
(1)
where Isurf and Ibulk denote the integrated intensities for the n 1 of Pyads and Pysol respectively, both can be obtained directly from the same Raman experiment. Nsurf and Nbulk represent the number of the corresponding Pyads and Pysol molecules effectively excited by a laser beam.
The Nsurf can be calculated by the following approximation after considering the surface area,
![]() (2)
(2)
where R is the roughness factor of the Pt electrode and a is the radius of the laser focal spot. Thus Rp a2 gives the total surface area which could be occupied by adsorbates and s is the surface area occupied by each adsorbate molecule.
In equation 1, the only unknown parameter is Nbulk. Since the confocal Raman microscope possesses very sensitive depth resolution, the term Nbulk in equation 1 is determined but it cannot be obtained using a conventional Raman spectrometer. Hence, it should confined exclusively to the special confocal feature of the microscope.
Fig. 8 (a) shows the waist profile of a focused laser beam in an aqueous solution. In principle, all solution species within the illuminated volume of the solution contribute to Nbulk. However, the collection efficiency of scattered photons from pyridine molecules in each plane of the solution varies with the confocal depth. The distance from the ideally focused plane is defined as z. When z equals zero the solution species therein contributes most to the overall intensity, the integrated intensity of which is defined as Imax. (see Fig. 8(b)). Experimentally, a single crystal silicon wafer immersed in solution is used to provide the confocal depth profile for the solution species. The integrated intensity of the strongest band of Si [a phonon vibration at 520.6 cm-1] is measured as the Si wafer plane is moved up and down vertically along the z direction i.e., z is scanned, all other conditions being kept fixed, as illustrated in Figs. 8 (a). A typical Raman intensity-distance (z) profile is given in Fig. 8 (b) as a solid line to simulate the confocal depth profile. It shows an abrupt decrease in both sides of the ideally focused plane (z=0) (a very typically Lorentzian distribution). For the illuminated volume of the solution, a plane of the solution can be imagined to move up and down vertically, as in the real movement of the Si wafer. It can be seen that the contribution from pyridine molecules outside the region of |z|>b is negligible compared with Nbulk.
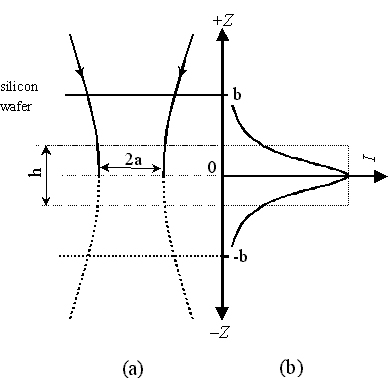
Figure 8. (a) The waist profile of laser beam in the solution on a confocal microscope. The Raman signal collected by the system from the solution species in this waist is simulated by moving a single crystal Si wafer up and down the focal plane. (b) The integrated Raman intensity for silicon wafer obtained in different distance from the focal plane. Pinhole size was set at 600 m m.
We now assume that an ultra-thin layer of the solution lies in the vicinity of the ideal focal plane in the shape of cylinder with height h and volume of hp a2 (see Fig. 8 (a)), in which all the pyridine molecules give the same contribution to the overall signal as that in the ideal focal plane. [In our case, the thickness is about 2 micrometers and the diameter is also about 2-3 micrometer.] The overall signal can be obtained by integrating the signal on the intensity-depth profile. Thus, the thickness h can be calculated from
(3)
The integral hImax is represented as a dashed-line rectangle in Fig 8 (b). The h value (in units of m m) can be considered as the key parameter of the confocal characteristic, it depends on the pinhole size and the magnification of the objective of the Raman instrument, and decreases with decreasing pinhole diameter. Therefore, the effectively illuminated number of pyridine molecules in aqueous solution, Nbulk, can be written as
![]() (4)
(4)
where c is the concentration of solution species and NA the Avogadro constant. Substitution of the Nsol and Nsurf in Equation.1 into Equation 2 and 4 yields the G value
![]() (5)
(5)
Substitution of known values into Equation 5, gives us the surface enhancement factor for any electrode and molecule with a detectable solution signal. The scan be different for each individual adsorbate e.g., for pyridine, it varies between 0.25 nm2 and 0.22 nm2. Thus, with the Raman signal detected on the electrode surface, and the known solution concentration and solution spectra, we can calculate the surface enhancement factor for different electrode materials, e.g., the surface enhancement factor for roughened Pt amounts to 102, and for Ni, and Fe electrodes the value amounts to 103, and depends on different surface roughening procedures [26-28]. A Raman signal can be detected if the enhancement lies between 10 and 100. This is adequate using modern Raman spectrometers. In the following section we give some examples of practical importance to demonstrate the value and potential of Raman spectroscopy as a powerful surface analysis spectroscopic tool.
Applications
Pyrazine adsorption on Ni surfaces
It is well known that pyrazine has a centro-symmetric (D2h), nonpolar structure which results in the separation of its Raman and Infrared active modes due to the so-called ‘exclusion principle’.
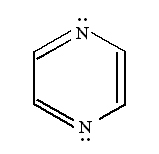
The modes assigned to the g-class are Raman-active and the vibrational modes anti-symmetrical to the inversion center (u-type) are Raman-inactive. In the normal Raman spectrum of the aqueous solution (Figure 9a), the fundamental vibrations of Ag symmetry at 1021, 1237 and 1591 cm-1 are attributed to the totally symmetric ring breathing (n 1), the C-H in plane deformation (n 9a) and the ring stretching (n 8a) modes, respectively [29]. The spectrum also exhibits a 703 cm-1 (n 4, B2g) and a 1528 cm-1 (n 8b, B3g)peak.
Although the spectrum is explicable within the exclusion principle very satisfactorily, the situation changes dramatically upon the adsorption of pyrazine. Potential dependent surface Raman spectra of pyrazine adsorbed at Ni electrodes are shown in Figure 9. The spectra were recorded from positive to negative potentials, starting at -0.6 V, where only one band is detected at 933 cm-1assigned to the totally symmetric stretching of ClO4– anion from the solution. A weak surface signal from the adsorbed pyrazine was observed at -0.7 V, indicating the adsorption of pyrazine at this potential. All the bands reach their maximum intensities at -1.1 V then disappeared completely at -1.6 V. Besides the drastic change of the peak positions and the relative intensities for the peaks at 632, 703, 1021 and 1591 cm-1 after adsorption, several new bands located at near 450, 795, 1045 and 1473 cm-1 and assigned to Raman ‘forbidden’ bands (u-class modes) appear in the surface spectra.
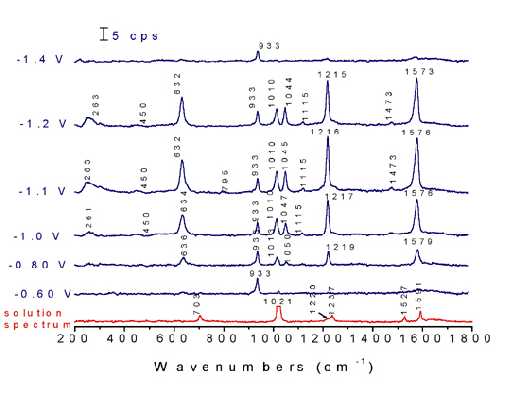
Figure 9. Normal Raman spectrum of 0.1 M pyrazine + 0.1 M NaClO4 and corresponding potential dependent surface Raman spectra on a roughened nickel surface in this solution. Excitation line: 632.8 nm.
These “abnormal” features can easily be understood once one accepts that due to the gross interaction of the Ni with the N atom of pyrazine (which is evident by the broad band at 263 cm-1), the point group of the pyrazine will be lowered from D2h to C2v by the removal of the inversion element. This changes the Raman-forbidden modes of the isolated molecule into Raman active modes of the total system because all modes are Raman active under C2v symmetry. The experiment of Irish et al also suggested that a vertical orientation model could lead to the breakdown of symmetry hence the appearance of the Raman ‘forbidden’ vibrations [30]. This study clearly shows that Raman spectroscopy can have more relaxed selection rules and that in some cases, Raman inactive modes can be observed, helpful in determining the adsorption behavior of adsorbates.
Thiourea adsorption on a Fe surface
Thiourea (TU) has long been known as an inhibitor and is widely used as an additive in electroplating and as a catalyst for some electrode reactions [31]. The adsorption and inhibition of TU have been investigated extensively by conventional electrochemical techniques [32,33], but the detailed mechanisms involved still remain unclear. Therefore, it might be helpful to gain a deeper insight into the mechanisms of the inhibition processes by using Raman spectroscopy, a proposal that can only be realized using contemporary Raman instrumentation.
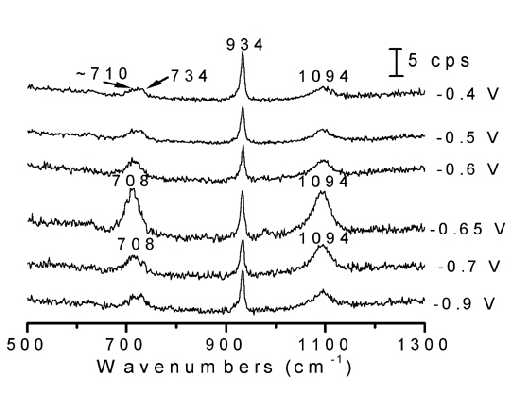
Figure 10. Potential-dependent surface Raman spectra of thiourea adsorbed at a Fe electrode. The solution was 0.1 M thiourea + 0.1 M NaClO4 + 0.01 M HClO4. Excitation line: 632.8 nm.
Surface Raman measurements were carried out on an ORC roughened Fe electrode surface, and are were given in Figure10. The potential sequence used started from the negative extremity of the potential range and moved towards more positive potentials so as to avoid the oxidation of TU and the formation of Fe oxides. In contrast to the case of the Raman spectrum from the bulk solution of TU in which the stretching vibrational mode the C=S fragment lies near 734 cm-1, the frequency of the CS vibration for the adsorbed TU down-shifts by about 25 cm-1. This significant change cannot be the result of the protonation of the S atom in acid solution because the SH stretching band was not observed throughout the whole potential range studied. Alternatively, the large shift in frequency could indicate that the TU interacts with the Fe surface through its S atom. Furthermore, it was found that as the potential is changed, all the intensities of the Raman bands alter significantly, but the frequencies change only slightly. At potentials positive to – 0.6 V, the surface Raman signals almost disappear. As can be deduced in any Raman spectra atlas the S-H is a vibration giving rise to strong Raman intensities, at least of the same order as that of C=N. In solution spectra we can observe the n (S-H). Thus, if we can not detect any signal from S-H, it is very possible that this kind of species does not exist on the surface. As suggested by the editor, if the change is due to the thio-enol form, we should be able to detect the n (N-H), since during our study we could clearly identify the SERS signal from n (NH2) at 3350 cm-1, this vibrational has been shown to have a comparable intensity to that of the n (NH) although in this case they are only of medium intensity. After considering the missing strong Raman S-H and medium intensity Raman N-H bands, we think NH2-CSH=NH does not exist in the present study, and that the change of the frequency is due to the bonding of S to the Fe surface, thus significantly affecting the Raman frequency of nC=S. )
Previous studies in our laboratory have revealed that the adsorption behavior of TU is more like a surface-active anion rather than a neutral organic molecule [34] i.e., TU has very large dipole so its sulfur atom acts as the negative part (the electron donor) and can interact with the Ag surface, which behaves more like a anion rather than a non-charge (neutral ) molecule. Therefore, we may expect the surface adsorption process of TU to be promoted when the electrode potential becomes more positive than the potential of zero charge (PZC). The maximum Raman intensity observed near – 0.6 V seems to indicate that the variation of surface coverage of adsorbed TU could explain the surface Raman intensity change with the potential. Consequently, the adsorbed layer, which suppressed the corrosion of Fe, is formed at relatively positively charged surfaces. This information might be helpful to give at the molecular level an understanding of why TU can be used as a corrosion inhibitor. This study demonstrates that the surface Raman spectroscopy can convincingly serve as a versatile surface analytical tool for practical application. We will now demonstrate the unique advantage of Raman spectroscopy, it’s ability to detect vibrational modes in the low frequency region and how it can be employed to investigate systems under vigorous reaction.
Application of Raman spectroscopy to electrocatalytic system during vigorous reaction
Methanol electrooxidation over Pt-based electrodes is one of the most extensively studied systems in terms of both fundamental and applied research in surface (interfacial) electrochemistry. It involves a very complex overall reaction involving an exchange of 6e– occurring in many steps and various kinds of surface (interfacial) species such as reactants, intermediates, poisons, supporting electrolytes and even solvent molecules [35]. Therefore, the characterization of the different surface species and surface structures during the electrochemical processes is of crucial concern.
In the past several decades, numerous electrochemical and non-electrochemical methods have been employed for the study of the methanol oxidation process, leading to a huge amount of experimental information available in the literature and to many articles giving extensive review viewed from various aspects [35,36]. Although great efforts have been made, an understanding of the mechanism of methanol electrooxidation at molecular level remains elusive [35,36]. Some important issues, such as the reaction path, the nature of the surface oxidant and intermediates, the influence of the surface morphology, the surface roughness and the presence of foreign metals on the reaction process, are still controversial. Raman spectroscopy on the other hand, due to its several unique features, can be used to study rough surfaces of dark colour and systems under rigorous reaction..
Figure 11(a) shows the corresponding surface Raman spectra of a Pt electrode in situ roughened in 1.0 M CH3OH + 1.0 M H2SO4. Besides the bands at around 450, 590, 980, 1018 and 1051 cm-1 which come from the solution species near the Pt surface, another two bands near 490 cm-1 and 2050 cm-1 can also be detected. These two bands are assigned to the stretching vibration of CO and Pt-C of linearly adsorbed CO. The Pt-C band is particularly helpful in determining the adsorption configuration of CO on the surface. If we plot the Raman intensity of the CO band against that of the oxidation current of the reaction, some interesting phenomenon will be found. Figure 11 (b) gives such kind of plot. The oxidation current of methanol increases rapidly with the oxidation of CO at around 0.3 V, and reaches its maximum at around 0.50 V. At more positive potentials, the oxidation current decreased rapidly. The current keeps growing with the oxidation of surface CO a conclusion deduced by the relevant Raman intensity. Thus with the increase of the oxidation current, the Raman intensity keeps falling.As the oxidation current reaches its maximum the band intensity of CO decreases to about 30% of its maximum. Nevertheless, Figure 11(b) demonstrates quite confidently that severe methanol oxidation can still go on in the presence of CO on the rough surface. The oxidation of methanol can go through the direct oxidation of methanol through the reactive intermediate and the oxidation of the poisoning intermediate of CO. This indicates that besides the oxidation through the formation of poisoning species of CO there must exist some other paths for the oxidation of methanol to keep the high reaction current density. This is a convincing evidence for the parallel mechanism [35-38] of methanol oxidation.
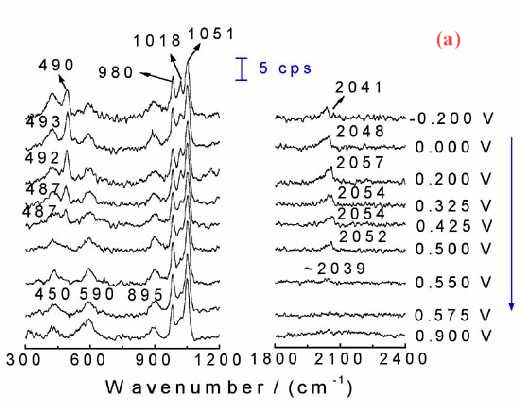
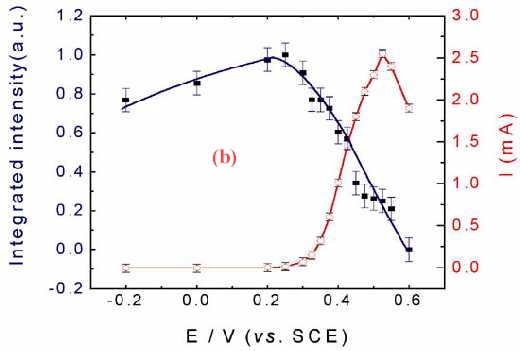
Figure 11. (a) Potential-dependent surface Raman spectra of a roughened Pt with roughness factor of about 200 in 1.0 M CH3OH + 1.0 M H2SO4; (b) The corresponding plot of the dependence of static state current Istat and band intensity ICO for the stretching vibration of linearly adsorbed CO on the electrode potential. Excitation line: 632.8 nm.
This phenomenon is coincides well with the results of both Sriramulu and Weaver et al. The former observed CO2 yields on both Pt(100) and Pt (111) surfaces at potentials where adsorbed CO was not oxidized [37]. The latter authors did not observe frequency changes in the V C-O stretch during the electrooxidation of 13CO pre-adsorbed onto the Pt electrode in a solution containing 12C-labeled methanol, suggesting that CO acts only as a surface stable product and not as a necessary intermediate [38]. It should be noted that, this kind of investigation is almost impossible in the IR, where normally thin layer cells are used, wherein the ohmic drop of the solution will be significant when the Faradaic current becomes larger. Raman spectroscopy, one the other hand, shows its distinctive advantage.
According to the parallel mechanism, it is essential to acquire the information from not only the poisoning intermediates but also the reactive intermediates [35,36]. Unfortunately, up to now, we have not been able to obtain exact information on the reactive intermediates probably because of their instability or their weak interaction with the Pt electrodes. It will only be possible to obtain Raman signals from these species after careful experimental design. More systematic work has been carried out, including the improvement of the experimental condition and theoretical calculation, in order to investigate the mechanism in more detail .
Prospects
In recent years, further improvements in Raman Instrumentation have been achieved, including the high quantum yield CCD detector (80% in the visible region and 40% in the UV region), and microscopic objectives of high numerical aperture (NA) and long working distance with cover glass correction. The latter makes measurements in electrochemical environments more convenient and of high efficiency. The combination of scanning near optical microscopy with Raman spectroscopy will enforce the power of Raman spectroscopy. It is not over optimistic to anticipate that with further developments in Raman instrumentation, the detection of single molecules and the study of species on single crystal surfaces will become routine.
Conclusion
This article introduces an approach exploiting a confocal microprobe Raman system to study surface and interfacial phenomena on transition metal surfaces. The central point of the tactic is to obtain highly active SERS substrates. It has been found that Pt electrodes can be prepared by oxidation and reduction under square wave potential control. The electrode is shown to have very good stability and reversibility and can be reused after electrochemical cleaning. Ni and Fe electrodes of high SERS active can be obtained by chemical etching in nitric and sulfuric acids. Highly SERS active substrates can also obtained by using template methods to generate transition metal nanorod arrays and electrodeposited thin films on SERS active gold substrates. The calculation of the surface enhancement factor based on the features special to the confocal configuration, shows that as high as three orders’ of magnitude enhancement is obtainable on transition metal surfaces. The Raman investigation of pyrazine adsorption on Ni surface shows that very strong signals can be obtained from Ni surface. The Raman signal clearly contains contributions from “Raman inactive” modes, resulting from strong interaction between pyrazine and the Ni surface and thus lead to breakdown of the molecular symmetry, from D2h to C2v. The investigation of the corrosion inhibitor, TU, adsorption onto Fe shows that the good anti-corrosion ability of TU is maintained at potentials more positive than the PZC, where the strongly adsorbed layer of TU is formed on the surface preventing the Fe surface from being corroded. The combined Raman and electrochemical investigation of methanol electrooxidation at Pt surfaces clearly favours the parallel mechanism and that CO formation is not the necessary step for the oxidation of methanol.
The present study clearly demonstrates that with appropriate surface preparation methods good enough SERS active surfaces can be made so that a reasonably highly sensitive Raman spectrometer will give spectra of such quality that the method can be developed into a versatile technique for investigating systems of practical significance.
Acknowledgements
The authors acknowledge the support of the National Natural Science Foundation of China and State Education Committee under contracts No. 29903009, 29833060 and 99177.
References
- M. Fleischman, P. J. Hendra and A. J. McQuillan, Chem. Phys. Lett., 26, 163 (1974).
- D. J. Jeanmaire and R. P. Van Duyne, J. Electroanal. Chem., 84, 1 (1976).
- M. G. Albrecht and J. A. Creighton, J. Am. Chem. Soc., 99, 5212(1977).
- M. Moskovits, Rev. Mod. Phys., 57, 783(1985).
- A. Otto, I. Mrozek, H. Grabhorn, W. Akemann, J. Phys.: Condensed Matter, 4, 1143 (1992).
- A. Campion, P. Kambhampati, Chem. Soc. Rev., 27, 241-249 (1998).
- M.P. Cline, P.W. Barber and R.K. Chang, J. Opt. Soc. Am., B3, 15 (1986).
- B. Pettinger, in J. Lipkowski, P.N. Ross (Eds.), “Adsorption of Molecules at Metal Electrodes“, VCH, New York, 285-345 (1992).
- M. Fleischmann, Z.Q. Tian and L.J. Li, J. Electroanal. Chem., 217,397 (1987).
- L.-W.H. Leung and M.J. Weaver, J. Am. Chem. Soc., 109, 5113 (1987).
- R.P. Cooney, M. Fleischmann and P.J. Hendra, J. Chem. Soc. Chem. Commun. (1977) 235.
- S.A. Bilmes, J.C. Rubim, A. Otto and A.J. Arvia, Chem. Phys. Lett., 159,89 (1989).
- B. Pettinger, A. Friedrich and U. Tiedemann, J. Electroanal. Chem. 280,49 (1990).
- M. Fleischmann, D. Sockalingum and M.M. Musiani, Spectrochim. Acta, 46A, 285 (1990).
- M.A. Bryant, S.L. Loa and J.E. Pemberton, Langmuir, 8, 753 (1992).
- T. Maeda, Y. Sasaki, C. Horie and M. Osawa, J. Electron Spectrosc. and Relat. Phenom., 64/65, 381 (1993).
- A. Visinitin, W.E. Triaca and A.J. Arvia, J. Electroanal. Chem., 221, 239 (1987).
- J. Clavilier, in Interfacical Electrochemistry, ed., A. Wieckowski, Marcel Dekker, New York, p231 (1999).
- Z.Q.Tian, W.H. Li, Z.H. Qiao, W.F. Lin and Z.W. Tian, Russian J. Electrochem., 31, 1014(1995).
- C. A. Foss, J. Gabor, L. Hornyak, J. A. Stockert and C. R. Martin, J. Phys. Chem., 98, 2963 (1994).
- J. L. Yao, G. P. Pan, K. H. Xue, Y. Xie, J. Tang, B. Ren, D. M Sun, B. W. Mao, Z. Q. Tian, Chinese Journal of Electrochemistry, 5, 371 (1999).
- S. Zou, C. T. Willians, E. K-Y., Chen, M. J. Weaver, J. Am. Chem. Soc., 120, 3811 (1998).
- S. Zou and M. J. Weaver, Anal. Chem., 70, 2387 (1998).
- M. J. Weaver, S. Zou, H. Y. H. Chan, Anal. Chem., 72, 38A (2000)
- R. L. Birke and J. R. Lombardi, in R. J. Gale (Ed.), Spectroelectrochemistry-theory and practice, Plenum Press, New York, 1988.
- Z. Q. Tian, J. S. Gao, X. Q. Li, B. Ren, Q. J. Huang, W. B. Cai, F. M. Liu and B. W. Mao, J. Raman Spectrosc., 29, 703 (1998).
- B. Ren, X. Q. Li, Q. J. Huang, J. L. Yao, W. B. Cai, B. W. Mao and Z. Q. Tian, Int. J. Vib. Spect., [www.irdg.org/ijvs] 1, 2, 7 (1996).
- W. B. Cai, B. Ren, X. Q. Li, C. X. She, F. M. Liu, X. W. Cai, Z. Q. Tian, Surf. Sci., 406, 9-22 (1998).
- A.G. Brolo and D.E. Irish, Z. Naturforsch., 50, 274(1995).
- G.R. Erdheim, R.L. Birke and J.R. Lombardi, Chem. Phys. Lett., 69, 465 (1980).
- B. Ke, J. J. Hoekstra, B. C. Sison and D. Trivich, J. Electrochem. Soc., 106, 382 (1959).
- R. Parsons and P. C. Symons, J. Chem. Soc., Trans. Faraday Soc., 64, 1077(1968).
- C. Yarnizky and R. Schreiber-Stanger, J. Electroanal. Chem., 214, 65(1986).
- Z. Q. Tian, W. H. Li, B. W. Mao and J. S. Gao, J. Electroanal. Chem., 379, 271(1994).
- R. Parsons and T. Van der Noot, J. Electroanal. Chem., 257, 1 (1988).
- A. Hamnett, in Interfacical Electrochemistry, ed., A. Wieckowski, Marcel Dekker, New York, p843 (1999).
- S. Sriramulu, T. D. Jarvi and E. M. Stuve, Electrochim. Acta, 44, 1127 (1998).
- Y. Zhang, X. Gao and M. J. Weaver, J. Phys. Chem., 97, 8656 (1993).
- B. Ren, X. Q. Li, C. X. She and Z. Q. Tian, Electrochim. Acta, in press.
REF: B. Ren, J.L. Yao, C.X. She, Q.J. Huang, Z.Q. Tian, Int. J. Vib. Spect., [www.irdg.org/ijvs] 4, 2, 4 (2000)