Secondary structure of proteins in the amorphous dehydrated state probed by FTIR spectroscopy. Dehydration-induced structural changes and their prevention

Kai Griebenow*,
Angelica M. Santos,
and Karen G. Carrasquillo
University of Puerto Rico,
Río Piedras Campus,
Department of Chemistry,
PO Box 23346,
San Juan,
PR 00931-3346
* Corresponding author, e-mail griebeno [at] adam.uprr.pr
Introduction
FTIR spectroscopy has been applied to study the secondary structure of proteins in aqueous solution for quite some time [13, 34,42,67,84]. However, other methods, such as crystallography in combination with X-ray structure determination and NMR spectroscopy, are frequently more suitable to gain detailed structural information, even at the atomic level, under such conditions. In addition, fluorescence-, absorption-, Raman-, CD-, and ESR-spectroscopy can frequently complement this information. Therefore, why would anyone use a methodology that typically does not provide detail information but rather an “overview” picture of global structural arrangements in proteins? The answer lays in the main strength of FTIR spectroscopy, the possibility to investigate protein structural changes under conditions not directly non-invasively accessible by other spectroscopic methods. For example, FTIR spectroscopy has proven to be a particularly useful tool in gaining a detailed understanding of protein structural changes upon protein binding to membranes or membrane-mimicking conditions [11,46,47].
The advantage of FTIR spectroscopy in such applications is that the physical state of the sample is irrelevant. This is because stray-light is surpressed due to its inappropriate modulation [11]. Based on the resulting flexibility, FTIR spectroscopy has recently been employed to determine the secondary structure of proteins under conditions where other spectroscopic methods could only be used with difficulty, if at all. These conditions include amorphous, dehydrated protein powders, suspensions of such in organic solvents, and encapsulated in polymer matrices.
Understanding the structure of proteins in such unnatural environments is important for many biotechnologically relevant areas and applications. For example, pharmaceutical proteins are frequently lyophilized to increase their shelf-life and further transportability [2]. However, proteins are susceptible to solid-state aggregation under such conditions [23]. FTIR spectroscopic results on various proteins have shown that dehydration-induced structural changes occur for most proteins and are responsible for the solid-state aggregation. Furthermore, FTIR spectroscopy was used to develop improved formulations for some proteins in the solid state, e.g., for recombinant human growth hormone, and to identify mechanisms of the prevention of detrimental solid-state aggregation [29].
In another area, the synthesis of chemical compounds using enzymes under nearly non-aqueous conditions in neat organic solvents, dehydrated enzyme powders are suspended in the solvents in many of the applications [55-57]. FTIR spectroscopy has been employed to investigate the structure of the enzymes under such conditions in order to gain insight on the influence of the protein structure on the catalytic performance [44]. In addition, FTIR spectroscopy has been used to investigate why proteins denature in mixtures of organic solvents with water but not in pure solvents [45]. The conditions tested included both, dissolved and suspended protein.
Finally, by utilizing the combined knowledge by the above experiments it was recently possible to stabilize the structure of two model proteins upon encapsulation in a hydrophobic polymer matrix [17,18]. Such encapsulation involves the exposure of proteins to very denaturing conditions, such as dehydration and organic solvents.
This review highlights the FTIR methodologies employed in these recent studies to demonstrate the applicability of FTIR spectroscopy as a fast and reliable method for exploring structure and function of proteins under various conditions. After discussing the vibrational modes of the peptide bond, the main analytical procedures employed are introduced, and limitations of the FTIR methodology are discussed. Finally, some recent results on lyophilized proteins are used to exemplify how the developed tools were employed to address important scientific issues.
Methods used to analyze the secondary
structure of proteins from IR spectra
The use of FTIR spectroscopy to analyze the structure of proteins has been reviewed extensively in the last years [3,7,11,49,83] and the following section is not meant to introduce the background theory comprehensively. Within this review only those techniques and methodologies employed in investigations on the structure of proteins in the amorphous solid state will be discussed.
Structurally sensitive vibrational
modes of the peptide bond
Figure 1 shows the IR spectrum of a water-soluble globular protein, human albumin, in the spectral window feasible for measurements with aqueous solvent. (Other amide vibrations overlap with some very strong water IR absorption bands at ca. >3000 cm-1 and <800 cm-1). The amide absorptions in this spectral region are labeled and named amide I, II, and III. The amide group, in model systems (e.g., N-methylacetamide), peptides, and proteins, exhibits 9 vibrational modes, giving rise to the amide bands A, B, and I-VII [7,58]. However, as pointed out by Arrondo et al. [3], due to technical and theoretical limitations, only the amide I, II, and III bands can be used to investigate the secondary structure of proteins. Normal coordinate analysis has revealed that the amide I is primarily a C=O stretching (C=O s) vibration with some contributions from CN s and CCN deformation (CCN def). In contrast, amide II and III are heavily mixed vibrational modes. The amide II is an out-of-phase combination of NH in-plane-bending (NH ib) and CN s with minor contributions from C=O ib, CC s, and NC s. The amide III is an in-phase combination of CN s and NH ib with some contributions from CC s and C=O ib. The interested reader is referred to the reviews of Krimm and Bandekar [58] and Bandekar [7] on normal coordinate analysis for details.
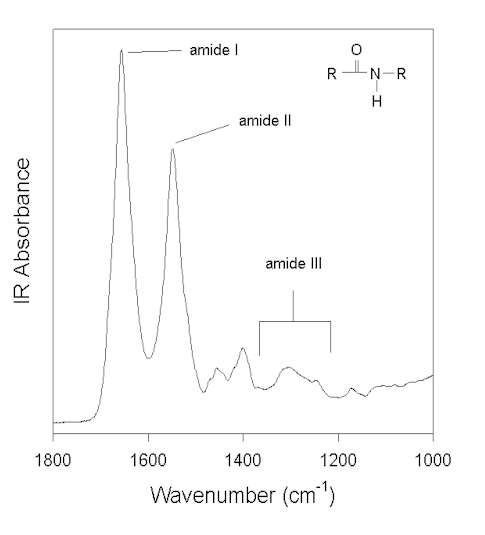
Figure 1. FTIR spectrum of human albumin in water (pH 7.3) after subtraction of the water background. Three vibrational modes of the amide bonds (see inset) are labeled: amide I, II, and III.
In a protein with n amino acids forming n-1 amide bonds, the amide frequencies of each single amide bond depend on specific properties of its environment. In particular hydrogen bonding, steric situations, and dielectric properties of the solvent are known to influence the frequency of the amide vibrations [86,87]. However, because the secondary structure in proteins is characterized by repetitive, very typical sterical and hydrogen bonding environments of the amide bonds, peptide groups belonging to one specific element of the secondary structure absorb at very similar frequencies. For example, the a-helix secondary structure of proteins (Figure 2) has an amide I maximum of ca. 1660-1655 cm-1. The same applies when analyzing the b-sheet secondary structure (Figure 3). Even though by above reasons the amide I, II, and III bands should be related to the secondary structure of proteins, the amide II is still not well understood and therefore excluded further on in this review [49].
Figure 2. Typical structure of the a-helix secondary structure in proteins. This a-helix was obtained using the program RasMol from the atomic coordinates of recombinant human growth hormone stored at the Brookhaven Protein Data Bank.
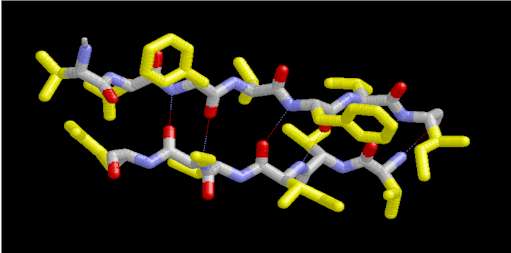
Figure 3. Typical structure of the b-sheet secondary structure in proteins. This b-sheet was obtained using the program RasMol from the atomic coordinates of an immunoglobulin G stored at the Brookhaven Protein Data Bank.
In principle, if the frequencies of all IR-active amide modes of each element of the secondary structure together with their respective molar extinction coefficients were established, one will be able to determine the secondary structure of any given protein precisely from its vibrational spectrum. Unfortunately, this is presently not the case. In fact, there is still some discussion even on the extinction coefficients of the most common secondary structure motifs in proteins.§Moreover, the frequencies at which the corresponding secondary structure elements absorb also vary somewhat from protein to protein. In spite of these obstacles, several strategies have successfully been applied to obtain estimates for the secondary structures of proteins from the shapes of the amide I and III region. These approaches and strategies are outlined below. Thereby we put emphasis on the amide I spectral region because theoretically it is comparatively well understood and has been employed thus far in probably more than 90% of all IR investigations of protein secondary structure [3].
| § In a recent work drastic differences for the amide I extinction coefficients of the different elements of the secondary structure have been reported [31], somewhat in contrast to investigations employing model peptides where much smaller variations have been found [49]. In addition, in light of the excellent correlation between secondary structure estimates and calculations from the atomic coordinates [see e.g., 13] where an equal extinction coefficient is assumed, the findings of de Jongh et al. [31] seem somewhat surprising. However, this issue awaits scientific clarification. |
Force-field calculations using “standard” conformations
This approach has been pioneered by Krimm and co-workers [see 7,58 for a recent reviews of this work] and also by some other groups [20, 66]. In short, the amide frequencies for certain well-ordered homo-polypeptides were computed and compared with those experimentally determined. The basis of this work is the established fact that many homo-polypeptides adopt a well-defined secondary structure in water, such as the a-helix (a-poly-L-alanine) and b-sheet (b-poly-L-alanine) structure. These investigations have provided a vast amount of information on the normal mode frequencies of a-helices, b-sheets, and to a minor extent of turns in the amide I, II, and III region, thus providing explanations for many experimental results. However, these theoretical data still can not completely account for the complex situation in proteins. First, solvent effects are excluded from these calculations. They are expected to be small for amide groups connected by hydrogen bonds, but they could be significant in instances for “free” amide groups. This is a well-established fact obtained from investigations of model compounds in various organic solvents [30]. Second, and even more important, the calculations were done for very well ordered, highly repetitive secondary structures, which are not always an appropriate model for the secondary structure observed in proteins. For example, a-helices in proteins have a different length which may give rise to IR frequency differences [66]. Furthermore, a-helices and b-sheets in proteins may be embedded into hydrophobic or at least amphiphilic environments, while those of model peptides are completely hydrated. Since a-helices have the capability to bind water strongly [6], some dependence of the amide mode on the hydration level could be expected. Finally, a-helices in proteins frequently exhibit some structural irregularities (e.g., bends and kinks)[8] which are also expected to influence the amide vibrations for these structures.
Semi-theoretical approach (amide I only)
An approach compromising the theoretical one described above and the semi-empirical one described below has been developed by Jackson and Mantsch [for a review see 49 and references herein]. Each element of the secondary structure is characterized by typical dihedral angles (p and F in the Ramachandran plot). Therefore, the hydrogen bonds formed by the C=O amide groups have a characteristic strength for each individual element of the secondary structure. The frequency of the C=O s vibration, the main amide I contribution, is related to the strength of the hydrogen bond formed: the stronger the hydrogen bond, the lower the electron density of the C=O group, the lower the frequency of the amide I absorption. Intermolecular b-sheets form the strongest hydrogen bonds and therefore absorb at 1610-1625 cm-1, intramolecular b-sheets at 1630 cm-1, unordered structures (hydrogen bonded to water or side chain groups) at about 1640-1650 cm-1, and finally a-helices with quite weak hydrogen bonds at about 1653-1660 cm-1. According to Jackson and Mantsch the vibration of the free amide I C=O s is expected at ca. 1670 cm-1.% IR bands in the amide I at ca. 1695 cm-1 are caused by the strong transition dipole coupling in b-sheets. However, there are bands at 1670-1690 cm-1 observed for protein amide I spectra. As an explanation for these frequencies the author use the concept of electron back-donation occurring when C=O groups are tilted out of plane by steric reasons, e.g., out of the plane of a cyclic ring [see e.g. 48] which yields uncharacteristically high C=O s frequencies. Such C=O groups tilted out of the amide plane by steric reasons can frequently be found in turns. Therefore, it is likely that much of the amide I absorbance in the spectral region under scrutiny is caused by turns. However, this is uncertain [49]. Overall, the above explanation has been proven very useful for the assignment of amide I bands to specific secondary structure elements.
| % Note that the frequency of the free amide C=O group in vacuum is at about 1706 cm-1 for N-methylacetamide monomers [86]. |
Semi-empirical approach.
Byler and Susi [13] developed this approach in scholarly work. This paper is still very useful – even though in the last 12 years marked technical, computational, and conceptual advances have been achieved in the infrared spectroscopic investigation of protein secondary structure. In this work, the authors investigate the amide I’ region of proteins. The amide I’ is the amide vibration after deuteration of the NH backbone groups. Technically, this can be easily (but not fully) achieved by dissolving lyophilized proteins in D2O followed by a prolonged period of incubation (typically 24 h at 4ºC). At the time of this work reliable subtraction of the strong water absorption band at ca. 1640 cm-1 was not easily possible due to limitations of the instrumentation (e.g., detector non-linearity). It should be noted that this is not the case anymore and it has become routine to determine the secondary structure of proteins in H2O [28,44,45] (vide infra). In D2O this band is downshifted and correction of the spectrum by background subtraction is quite easy in the amide I region.
As already mentioned, the individual bands are strongly overlapping in the amide I and I’ region. Therefore, resolution-enhancement (better called band-narrowing) is required prior to the analysis by curve-fitting procedures. Some investigators, however, prefer to use the original amide I spectra for curve-fitting [see e.g. 83]. We do not follow this recommendation because too many possible solutions may arise. We recommend instead to follow the method developed by Byler and Susi [13] who band-narrowed their spectra by Fourier-selfdeconvolution [51,52,65,91]. The secondary structure was then subsequently determined by Gaussian curve-fitting (see Figure 4), i.e., the spectral shape is fitted by a sum of Gaussian bands. From the areas of these individual bands – after their assignment to the specific elements of the secondary structure – their presence in the protein structure are calculated from their fraction of the total band area in the amide I region [13, 44,45].
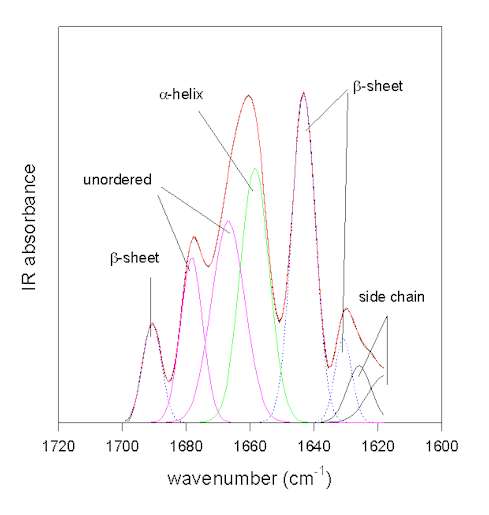
Figure 4. Gaussian curve-fitting of the resolution-enhanced amide I spectrum of bovine pancreatic trypsin inhibitor (pH 7.0). The original spectrum (full black line) and the result of the fit (full red line) coincide.
The individual Gaussian bands are colored according to their assignments: green: a-helix; blue: b-sheet; magenta: unordered; black: side chains.
In their approach, Byler and Susi [13] used proteins where the atomic coordinates were known with sufficient accuracy from X-ray crystallography and the secondary structure was calculated by others from these coordinates [50, 63]. After the Gaussian curve-fitting procedure the resulting component bands were assigned for all proteins in the same way, depending on their frequency. The band assignments were based on both, empirical and theoretical knowledge from normal coordinate analysis. Using this approach, the authors were able to demonstrate that the a-helix and b-sheet contents can be calculated with great accuracy from the amide I’ IR spectra of proteins. Only proteins with a very high a-helix and very low b-sheet content caused some problems. The “extended chains” in these proteins (the segments at the ends of the helices) absorb at similar frequencies as do b-sheets. Therefore, strictly spoken, theb-sheet content of a protein can not be determined with the same accuracy from the amide I’ spectrum as the a-helix content. The only solution to this problem is the simultaneous investigation of a second spectral region, the amide III, or employment of an alternative method, such as CD- or Raman-spectroscopy.
In a similar fashion as outlined above, Singh and co-workers employed the amide III spectral region to calculate the secondary structure for various proteins [40,80,81,82]. Even though the amide III is much weaker than the amide I, better band separation allows for curve-fitting without the need of employing resolution-enhancing methods. The results by Fu et al. [40] based on a set of structurally differing proteins, have been confirmed for other proteins by Griebenow and Klibanov [43] who found that the amide III results and X-ray data were in good agreement for most proteins.
Similarly, Dong et al. [34] established the band-assignments for the amide I in water. These authors employed second derivative spectra in the curve-fitting procedure. Band-narrowing by second derivatization is suspected not to be a sound approach [49]. However, again the assignments have been proven to be correct when using other proteins and employing FSD as the band narrowing methodology [17,18,29,44,45].
The methodology is exemplified in Figure 4 for the protein bovine pancreatic trypsin inhibitor at pH 7.0 in the amide I area. In this case the original spectrum was band-narrowed by FSD using the parameters of FWHM 25 cm-1 and enhancement factor k = 2.8 using the program OMNIC. The result of the Gaussian-curve fitting is shown in red and coincides with the measured spectrum. The individual Gaussian bands were assigned according to the literature. This example was chosen because the b-sheet structure of BPTI absorbs at a somewhat uncharacteristically high frequency of ca. 1643 cm-1close to the absorbance of unordered secondary structures. This exemplifies that careful assignment of the bands is required because for some proteins atypical frequencies are found [49]. For all other bands standard assignments (see Table 1) can be used. The result of this fit suggests that BPTI has 26% of a-helix and 41% of b-sheet secondary structure. This is in excellent agreement with the X-ray structural data (26% a-helix and 45% b-sheet) and amide III analysis (20% a-helix and 43% b-sheet; )[43].
Quantification of changes in protein secondary structure.
In the following, we confine ourselves on describing those methods for the quantitative analysis of protein secondary structure that were applied to dehydrated, solid protein powders. Not included are more recent approaches that use calibration sets (FTIR spectra of proteins with known X-ray structures) in combination with factor analysis procedures [see 3 for a review]. All these approaches work well – but statistically not much better than the Gaussian curve-fitting procedures. The interested reader is referred to the original literature [for example, 37,61,74,77].
Correlation Coefficient
The calculation of the correlation coefficient was introduced by Prestrelski et al.[72,73] to quantitate dehydration-induced structural changes in proteins. In principle, however, the method can be employed to characterize the overall-structural changes occurring in a protein upon any changes in the environment. This method is explained in detail in the section describing dehydration-induced structural changes in proteins.
Area Overlap Method
The “area overlap method” was introduced by Heimburg and Marsh [47] to analyze spectral changes occurring upon heat-denaturation of cytochrome c. Therein, protein vibrational spectra measured at various temperatures were resolution enhanced by FSD in the amide I region. Difference spectra were obtained by subtracting area-normalized spectra obtained at elevated temperatures from that of the native protein (in our case at 25ºC). The changes in total area above the baseline can be used to determine the melting temperature Tm. These changes are a quantitative description of overall structural changes occurring in proteins upon changes in the environment.
A modification of this methodology has been applied by Kendrick et al. [54] to characterize dehydration-induced structural alterations in proteins. In short, amide I protein spectra were area-normalized after calculating the second derivative spectra followed by baseline correction. The integrated differences in the area between two samples were used as a quantitative criterion to describe overall structural changes. The rationale by Carpenter and co-workers [15] for employing this method instead of the correlation coefficient method (see above, developed by the same research group) was, that the correlation coefficient method was hampered occasionally by baseline-offsets in the second derivative spectra that could not be accounted for appropriately. However, we do not recommend the method because any quantitative use of second derivative spectra is problematic [49]. Instead, we prefer the method of Heimburg and Marsh (or at least the use of area normalized FSD spectra in the method of Kendrick et al., [54]).
We have developed a method that does not rely on self-written programs and can be done with the typical software used to run FTIR instruments (e.g., OMNIC) and a good spreadsheet program (e.g., SigmaPlot). Herein, we first resolution enhance the spectra to be compared by FSD. It is important to use the same values for both samples for the bandwidth and enhancement factor. These FSD spectra are then baseline corrected in the amide I region. Next, both spectra are area normalized to 100 for the spectral region to be employed (e.g., 1700-1600 cm-1 for the amide I). The spectral region to be compared is then saved as ascii (.txt) file. The spectra to be compared have to be saved with the same data spacing and on exactly the same wavenumber scale. These spectra have then to be imported into a spreadsheet program. In SigmaPlot the 1st column contains the wavenumber scale of sample 1, the 2nd column the IR intensities of sample 1, the 3rd the wavenumber scale of sample 2, and the 4th the IR intensities of sample 2. It is then easy to compute the difference spectrum for both samples and store the difference spectrum in column 5 (e.g., col(5)] = col(2) – col(4)). Next, the mathematical operation summing up the absolute differences (e.g., col(6) = max(sum(abs(col(5)))) gives the area of difference, e.g. 22. Since the spectra were normalized to an area of 100, this represents 22% area that is different between the two spectra. The area-overlap is therefore 78% for this example. This whole procedure is exemplified in Figure 5 using the above example.
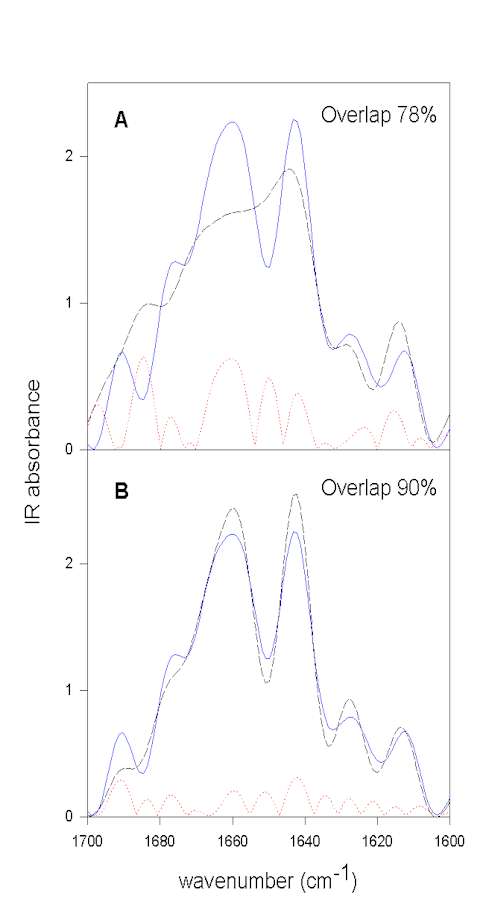
Figure 5. Quantification of overall protein structural differences by calculating the area overlap between normalized spectra. All spectra shown were normalized to the same area in the amide I spectral region. The FSD spectrum of BPTI in aqueous solution prior to lyophilization (pH 3.5) is shown in blue (full line).
Figure 5A. compares this spectrum with that of the lyophilized powder (broken black line),
Figure 5B. with that of the spectrum of redissolved BPTI. The dotted red line represents the calculated absolute difference between the spectra shown, which is used to calculate the area difference. From the area difference in the next step the area overlap (total normalized area minus area difference) can be calculated. It is evident that lyophilization induces structural changes and that these changes are largely reversible upon redissolving the protein in water.
Gaussian Curve-Fitting
The general applicability of curve-fitting procedures to quantitate protein secondary structure has already been presented above. The following focuses in particular on important issues with respect to studying the solid-state structure of proteins.
Amide III
This region has been established using similar semi-empirical approaches as before described for the amide I [13] by Singh and co-workers [40,80-82]. Herein, various proteins with solved X-ray structures were measured by FTIR spectroscopy. Results on the secondary structure composition obtained by Gaussian curve-fitting were compared with the X-ray crystallographic data. Overall, the analysis revealed an excellent agreement between secondary structures derived by both methods, a finding consolidated for other proteins by Griebenow and Klibanov [43]. In addition, it has also been shown that results obtained from Gaussian curve-fitting of amide I and amide III are in good agreement [40,44,45]. However, it has to be pointed out that the theoretical understanding of the origin of the vibrations in the amide III is not as good as for the amide I [49]. While the amide I mainly consists of C=O s with minor CN s and CCN d contribution, the amide III is a more complex vibrational mode. It mainly is the in-phase combination of NH in-plane-bending and CN s with contributions from CC s and CO ib [7]. It has been suggested that there may not be a correlation between amide III bandshape and secondary structure content of proteins [49]. This is in obvious contrast to various investigations on proteins with well known structures where a clear relation of the amide III bandshape and the secondary structure has been established [40, 43]. This discrepancy between theoretical models and experiment suggests that the formers are not yet complete for the amide III. More theoretical work is required for developing a thorough understanding of the amide III.
In the following, we show an example demonstrating that results of the secondary structure determination in the amide III region are consistent with those in the amide I. Human growth hormone, a protein with a high a-helix content of ca. 55% [16], was studied in aqueous solution at various pH-values. The secondary structure was then determined at these pH-values from the protein vibrational spectra. It is evident from Figure 6 that structural changes are reflected in the amide I, I’, and III to the same extent. This result strongly suggests that in this case the a-helix bands were assigned consistently and correctly in the amide I and III spectral region. This is in agreement with the data of Griebenow and Klibanov [45] for the denaturation of lysozyme and subtilisin by mixtures of organic solvents and water. Herein, the a-helix contents determined in amide III and I were also in agreement for the native and largely denatured states of the proteins. Thus, in IR experiments the amide III and I behave similar. In conclusion, we found that the amide III is a very useful spectral feature to analyze the secondary structure of proteins. Real drawbacks of the amide III spectral region result from its overlap with vibrations of other molecules. This is a problem when investigating proteins in co-lyophilizates with polyols and in organic solvents because appropriate correction for the additive by subtraction is often not possible.
Figure 6. a-helix content of recombinant human growth hormone at various pH-values determined by Gaussian curve-fitting of the protein vibrational spectrum in the amide I, I’, and III region
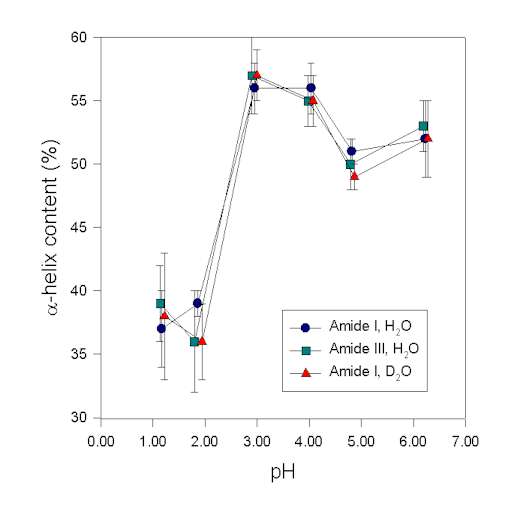 Figure 6. a-helix content of recombinant human growth hormone at various pH-values determined by Gaussian curve-fitting of the protein vibrational spectrum in the amide I, I’, and III region.
In summary, we are convinced that the use of the amide III is advantageous, when the following conditions are fulfilled for the specific protein to be studied:
- The results of the Gaussian curve-fitting and the X-ray crystallographic data are in agreement for the protein in aqueous solution.
- Quantitative results obtained in amide I and III are also in agreement.
- Under such circumstances the amide III can be utilized to follow the effects of environmental changes on the structure of the protein.
Amide I
After FSD
As outlined earlier, Gaussian curve-fitting using amide I protein spectra after resolution-enhancement by FSD has been used to quantitate the secondary structure of proteins in aqueous solution. The use of this methodology to quantitate the secondary structure of proteins in the dehydrated state was found problematic due to the band-broadening accompanying protein dehydration [35,72]. These authors argued that due to changes in the component bandwidth the spectra of the aqueous and lyophilized protein could not be resolution enhanced using the same FWHM and enhancement factor and could therefore not be directly compared with each other. However, this limitation has been overcome by the use of the amide III which does not rely on resolution-enhancing methods (see above). This enabled comparison of the a-helix and b-sheet content determined after FSD in the amide I with those determined from the amide III. In general, only minor differences were noted [44,45]. Therefore, it can be concluded that FSD can be applied to resolution-enhance the spectra of a protein in aqueous solution and the lyophilized state using the same FWHM and enhancement factor prior to Gaussian curve-fitting. However, it is still recommended to compare the results obtained in amide I and III for the aqueous solution and the lyophilized powder for each new protein to be studied. Recent studies have employed this strategy to explore the effect of additives on the secondary structure of proteins, where the use of the amide III is prevented because of strong IR absorbencies of the additives in the amide III spectral region [17,18,29].
After 2nd derivatization
As mentioned earlier, it has been suggested to use second derivatization as resolution enhancement method prior to Gaussian curve-fitting in the amide I spectral region. This approach was introduced by Dong et al. [34] to analyze the secondary structure of proteins in aqueous solution. Others have criticized this approach because relative integrated intensities of bands are not retained after applying this method [e.g., 49], or defended it [35]. In light of this dispute, it seems to be more appropriate to use the two methods outlined above for quantitating the secondary structure of proteins in the solid state.
Which spectral region should I use?
Figure. 7 exemplifies the results obtained by Gaussian curve-fitting in the amide I, I’, and III in comparison. It should be noted that this comparison does only include data from some selected papers and should not be taken as being comprehensive at all. However, qualitative analysis of the plots given in Figure 7 allows for an evaluation of the different fitting procedures in comparison. The data for the amide I region were mainly obtained from Dong et al. [34] (myoglobin, cytochrome c, ribonuclease A, lysozyme, a-chymotrypsin, trypsin, alcohol dehydrogenase, concanavalin A, and immunoglobulin G). Herein, the authors quantified the secondary structure composition by Gaussian curve-fitting of amide I second derivative spectra after baseline correction. In addition, data on subtilisin Carlsberg from Griebenow and Klibanov [44] and recombinant human growth hormone [29] after band-narrowing by FSD are also included. It is evident that the a-helix content is estimated very accurately from IR spectra in the amide I. This is in contrast to some statements in the literature that a-helix and unordered secondary structure produce strongly overlapping bands in the amide I therefore artificially increasing the a-helix content [40]. We do not find this to be a significant problem. The a-helix band is typically found between 1655 and 1660 cm-1 (Table 1) and therefore well separated from unordered secondary structure (“random coil”) at 1645-1650 cm-1. However, estimation of the b-sheet content is problematic when using the amide I solely for some proteins with a high a-helix and low b-sheet content, such as myoglobin or human growth hormone. This is because the extended chains of the a-helices in such proteins absorb at the same frequency as b-sheets (approximately 1630 cm-1). Therefore, from investigating the amide I IR spectrum of a protein, one can not be sure about the b-sheet content without knowledge of the atomic coordinates.
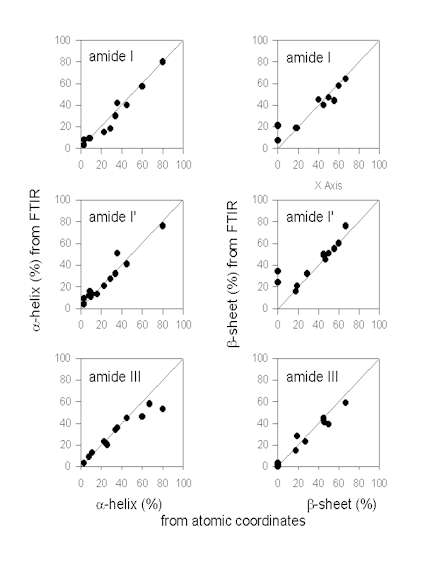
Figure 7. Secondary structure content (a-helix and b-sheet) content determined from IR protein vibrational spectra and the atomic coordinates.
Table 1. Infrared frequencies of common protein secondary structures.
The same is also true for analysis of protein spectra in the amide I’ region. Most of the proteins shown here were taken from Byler and Susi [13] [cytochrome c, RNAse A, chymotrypsinogen, lysozyme, a-chymotrypsin, trypsin, concanavalin A, immunoglobulin G, elastase, carbonic anhydrase, and papain]. In addition, data on subtilisin Carlsberg from Griebenow and Klibanov [44] are included. Again, the
| Structure | Frequency (cm-1) | ||
| Amide I | Amide I’ | Amide III | |
| a- helix | 1654-1660 | 1650-1660 | 1290-1335 |
| b-sheet | 1690-1698 | 1675-1695 | 1215-1250 |
| 1624-1642 | 1625-1640 | ||
| b-sheet [aggregation] |
1690-1698 | 1675-1695 | 1215-1250 |
| 1610-1628 | 1610-1628 | ||
| unordered | 1645-1653 | 1640-1650 | 1250-1290 |
a-helix content is estimated very precisely in this spectral region, while the b-sheet content is estimated too high due to the overlap of the IR bands of extended chains and b-sheets for some proteins with a very high a-helix and low b-sheet content. This fact has been pointed out in the paper of Byler and Susi [13] who discuss proteins with a high a-helix content separately.
The amide III data were compiled from papers of Fu et al. [40] (lysozyme,
a-chymotrypsin, immunoglobulin G), Griebenow and Klibanov [42] (myoglobin, cytochrome-c, bovine pancreatoc trypsin inhibitor, recombinant human albumin, RNAse A, chymotrypsinogen), Griebenow and Klibanov [44] (subtilisin Carlsberg), Costantino et al., [26] (recombinant human growth hormone), and Costantino et al. [28](recombinant human deoxyribonuclease). From the plot of the a-helix contents it can be easily seen that there are some problems in the determination of the a-helix content for proteins with a very high a-helix content (>60%). It seems that in these instances the assignments for bands should be revisited. It may be possible that some bands at wavenumbers <1290 cm-1 have also to be assigned to a-helices [16]. In contrast, determination of the b-sheet content is better in the amide III than in the amide I and I’. It is evident therefore, that the analysis of the amide III complements those of amide I and I’.
In conclusion, both, the amide I and III region should be analyzed simultaneously, if possible. Since there are no technical limitations anymore with the water subtraction in the amide I [34, 44,45], this does not require additional measurements. Furthermore, simultaneous analysis of amide I and III is also possible for protein powders when they are dehydrated without additives [see e.g., 44,45].
Sample preparation considerations
Studying the structure of a protein in the solid state does not require employing additional expensive accessories, such as those for diffuse reflectance or attenuating total reflectance measurements. The protein can simply be measured pressed into a KBr pellet. It is now established that the procedure used to produce KBr-pellets does not induce protein structural changes [26,29,72,73]. In principle, because of the employment of high-pressure during the pellet preparation, there were some concerns on procedure-induced protein structural changes. High pressure is known to affect the structure of proteins in aqueous solution [62,71,85]. However, the following works established that this is not a problem when working with dehydrated protein powders:
- Spectra obtained for dehydrated proteins pressed between CaF2 windows, polymer films, and in KBr pellets were very similar (the signal-to-noise ratio however is much better for proteins measured as KBr-pellets) [72].
- Spectra of dehydrated bovine serum albumin and lysozyme measured as KBr-pellets and as dispersion in Nujol were indistinguishable [41].
- For recombinant human desoxynuclease (rhDNAse) early reports indicated some influence of the conditions employed during pellet processing on the bandwidth in the amide I. However, more detailed analysis revealed that no significant procedure-induced structural changes occurred when varying the conditions over a wide range [28].
- Various proteins – when co-lyophilized with certain additives, such as polyols – have a spectrum extremely similar to that in aqueous solution in KBr-pellets [17,18,29,35,72,73]. This largely excludes procedure-induced alterations of the structure of proteins.
However, it has to be pointed out that the above scenario may only hold true for dehydrated proteins. In such powders the conformation of the protein is kinetically trapped due to the increased rigidity of proteins when the “molecular lubricant” water is removed [45]. When proteins are exposed to conditions where they are able to sorb water (experimentally in humidity chambers or accidentally by opening a vial with lyophilized powder that was stored in the refrigerator), it may be possible that the rigidity is significantly decreased. This, in consequence, could lead to a somewhat higher susceptibility of the proteins to undergo procedure-induced structural changes. Thus, under such circumstances the use of techniques that do not require sample preparation, in particular diffuse reflectance measurements using silicon carbide samplers, are recommended. Such investigations are currently ongoing in our laboratory.
Lyophilization-induced structural changes in proteins
Theoretical investigations implied for quite some time that dehydration of proteins should result in pronounced structural alterations. For example, Kunz and Kauzman [59] theorized what would happen if one would dehydrate a protein crystal. They concluded that they would expect conformational changes to occur caused by the enormous unsatisfied intermolecular forces when removing water from the spaces between the protein molecules. The authors also expected the rigidity of the proteins to increase upon dehydration thus preventing the individual molecules from reaching an equilibrium state. Therefore, the protein molecules should be trapped in various conformational states depending on the exact conditions of the dehydration. In consequence, the authors predicted a dependence of the final protein structure reached on the mode of dehydration.
However, until recently, the issue on the conformation of proteins in the dehydrated state was very controversial. Early IR works were mainly performed by difference spectroscopy between one dehydrated protein powder and a set of partially hydrated protein powders (mainly employed was hen egg-white lysozyme).# Due to technical restrictions, these investigations in addition employed partially deuterated samples. Without presenting clear evidence, some groups claimed that the structure of lysozyme in aqueous solution and the dehydrated state is the same [14, 76]. However, it was easy to miss fine spectral changes in the amide I due to the lack of a proper resolution-enhancement methodology at this time and the use of difference spectra. Other studies contradicted these believes. For example, Baker et al. [5] interpreted the increase in the overall tritium-exchange rate upon dehydration as strong though indirect evidence for lyophilization-induced structural changes in lysozyme. Raman spectroscopy has also been used to study the structure of lysozyme in solution, as crystal, and in the lyophilized state. From comparison of the spectra in the amide III region the authors qualitatively concluded that lyophilization caused some main-chain conformational changes [92]. Similarly, Poole and Finey reached this conclusion using Raman- [68,69] and IR-spectroscopy [70]. Interestingly, works on this matter disappeared then for quite some time until the early 90s.
| # A comprehensive review on protein hydration by Rupley and Careri appeared 1991[75] as the Vol. 41 of Advances in Protein Chemistry, Academic Press. Except for the fact that protein-structural changes are largely treated as insignificant in this review, this work is a very valuable source for many aspects of protein hydration. |
The first direct proof for lyophilization-induced structural changes occurring in proteins was presented by Carpenter and co-workers in scholarly work utilizing the potential of FTIR spectroscopy [72,73]. Herein, various proteins belonging to different structural classes (mainly a-helix, mainly b-sheet, or mainly unordered secondary structure) were measured in aqueous solution and in the lyophilized state as powders pressed into KBr pellets(1 mg protein per 200 mg of KBr). The spectra were then analyzed in the amide I spectral region by first calculating the second derivative spectra. Next, the overall spectral and thus structural differences were quantified by calculating the correlation coefficient r according to the following equation:
Xi and Yi are the absorbance values of the sample in water and the lyophilized state at the frequency i.& The resulting r from such calculations is 1 when the spectra are identical and 0 if they have nothing in common. Thus, calculation of the correlation coefficient allows a mathematical description of overall spectral changes occurring.
| & In our laboratory, after correcting the spectra for the background and all water vapor contributions, we first calculate the second derivative spectra in the amide I using the program OMNIC 3.1 (Nicolet) and smooth them twice with a 10.6 cm-1 function. Next, these second derivative spectra are saved in text only format (filename.csv in OMNIC) for the spectral range required (e.g., 1700-1600 cm-1). Technically the easiest way is to open all 2nd derivative spectra generated in one OMNIC window showing exactly the spectral region under scrutiny. When saving all spectra from one window they are saved having exactly identical wavenumber scales and data spacing – essential for the analysis. Next, the xy-data sets for the reference spectrum (e.g., the aqueous solution) and the spectrum with varied condition (e.g., after dehydration) are imported into the program SigmaPlot (Jandel Scientific) and the correlation coefficient is calculated using the Math – Transforms option. The simple routine required is available upon request from the corresponding author via e-mail. |
This method is exemplified in Figure 8.
Figure 8. Second derivative spectra of bovine pancreatic trypsin inhibitor in the amide I spectral region. [A] Aqueous solution, [B] lyophilized powder, and [C] lyophilized powder re-dissolved in water. The numbers indicate the quantified overall changes in the secondary structure by calculation of the correlation coefficient.
Using the correlation coefficient Prestrelski et al. [72] were able to demonstrate that lyophilization induced structural changes in all proteins involved in their study belonging to different structural classes, but to a varying extent. They also clearly showed that polyols prevented such structural changes (vide infra). The same polyol, however, worked with different efficiency for different proteins.The second derivative spectrum of the native protein, in this case bovine pancreatic trypsin inhibitor, is shown in Figure 8A. Several well-resolved bands can be observed with frequencies at ca. 1691 cm-1 (b-sheet), 1775 cm-1(shoulder, unordered), 1661 cm-1 (unordered, a-helix), 1642 cm-1(b-sheet), 1624 cm-1 (side chain), and 1613 cm-1 (side chain). Lyophilization of the protein caused significant spectral changes in the amide I (Figure 8B). These were strictly interpreted as indication for changes in the protein structure (vide infra). When calculating the correlation coefficient between spectrum A and B the result of 0.79 indicates overall structural alterations. When this powder is redissolved in water, the resulting spectrum is very similar to the one of BPTI prior to lyophilization – the reversibility of lyophilization-induced structural perturbations is reflected in the r-value of 0.99 calculated between spectrum A and C. Thus, we can conclude that the calculation of the correlation coefficient allows for the fast diagnosis of structural changes in proteins, but that we do not gain any knowledge on what 0.79 means in protein structural terms.
It is important to note that the spectral changes in the amide I are (mainly) a result of protein structural changes and not just caused by the removal of water per se causing the spectral changes (e.g., because of changes in the extinction coefficients). Supporting arguments are summarized in the following:
-
- Similar changes in the spectra of all proteins would be expected if removal of water per se would cause spectral changes. This is not the case. Quite in contrast, spectral changes vary from very little [27] to very significant e.g., for a-lactalbumin and a-casein in the work of Prestrelski et al., [72].
- Spectral changes are prevented to a varying extent by co-lyophilization with lyoprotectants. Prevention of spectral changes in these experiments has been shown to correlate with prevention of irreversible denturation, e.g., in case of lactate dehydrogenase and phosphofructokinase [72,73]. Thus, the spectral changes seem to be a good measure for protein structural changes.
- In many cases the spectral changes are not (fully) reversible upon re-dissolving the dehydrated protein powders in aqueous solution. If they would have been caused by the removal of water per se, they should be completely reversible in all cases.
- Investigations using the model peptide poly-L-lysine have shown that peak frequencies and intensities do not vary upon dehydration when the peptide is lyophilized from the b-sheet structure [72]. Thus, spectral changes for b-sheets caused by the removal of water must be very small.
- Co-lyophilization of proteins in the presence of salts known to destabilize protein structure caused an increase in the lyophilization-induced structural changes [1,35,72].
- When one particular protein is co-lyophilized with a set of structurally related polyol lyoprotectants, some are efficient in preventing any spectral changes, others are not [17,18,29]. Thus, in the presence of such lyoprotectants the spectrum for the protein can be nearly unchanged compared to that in aqueous solution or it can be like that of the powder obtained without any excipients. Since all these lyoprotectants can serve as hydrogen bond donor and acceptor and thus replace water in this function and the physical state in all samples proved to be comparable e.g., a very similar water content [29], this rules out the possibility that major spectral changes are simply caused by the removal of water.
- When dehydrated proteins are suspended in anhydrous organic solvents with varying properties, very little spectral changes occur [45,44]. Since solvents with quite a variation in physicochemical properties were used, the influence of such environmental changes on the IR spectrum in the amide I is very small, supporting the notion, that spectral changes in the amide I are mainly due to structural changes.
Results obtained in the amide I and amide III are in quantitative agreement [28-29,43-45]. It seems unlikely that this would be the case as a result of changes other than structural because the amide modes consist of quite different contributions.
In summary, convincing though indirect evidence has been presented that spectral changes in amide I and III reflect protein-structural changes upon dehydration. The interpretation of spectral changes being the direct result of the removal of water lacks any such evidence.
However, one additional issue that has to be discussed in this context is the vibration of the so-called random coil portion of proteins. It is obvious that in random coil portions of proteins hydrogen bond donors other than the peptide NH backbone group must satisfy the H-bonding capability of the backbone amide carbonyl groups. This could be by hydrogen bonding to various suitable side chain groups or to water as the H-bond donor. Indeed, it has been shown that in crystals of hen-egg white lysozyme 42 water molecules are hydrogen bonded to peptide C=O groups [10]. In the latter case, removal of water could lead to “free” instead of H-bonded carbonyl groups and a frequency increase in the amide I is expected under such circumstances. On the other hand, H-bonding of free carbonyl groups to suitable side chain groups or NH-backbone groups could also occur and even provide the driving-force for the structural rearrangements. However, it can not be excluded that some (probably small) amount of spectral changes in the amide I are indeed a direct consequence of the removal of water because free C=O groups are generated. This is consistent with an increase in intensity for amide I bands between 1670 and 1690 cm-1, frequently observed upon lyophilization of proteins [see eg., 29].
The knowledge on structural changes upon lyophilization has been significantly extended afterwards by Griebenow and Klibanov [43]. In particular, employment of the amide III spectral region proved fruitful in this context. The problem with the exclusive use of the amide I in the work of Prestrelski et al. [72] was that the situation with already strongly overlapping amide IR-bands for proteins in aqueous solution was significantly worsened by further broadening of the individual bands upon dehydration. As the result, Prestrelski et al. [72] did not feel confident in using resolution-enhancement methods in combination with Gaussian curve-fitting to quantitate changes in the a-helix and b-sheet content. The amide III spectral region (ca. 1215-1335 cm-1) has some advantages in such applications over the amide I, in particular the better separation of the spectral components caused by the individual elements of the secondary structure [40, 80-82], as outlined earlier.
Employing the amide III spectral region, Griebenow and Klibanov [43] were able to show that lyophilization induced similar structural rearrangements in the structure of various proteins. Gaussian curve-fitting analysis of the amide III band revealed for all proteins a significant drop in the a-helix content and an increase in the b-sheet content as the result of dehydration. However, the magnitude of the structural perturbations was protein dependent. For example, while drastic changes occurred for the mainly a-helical proteins myglobin and human albumin, proteins with a high b-sheet content and low a-helix content (e.g., chymotrypsinogen) appeared somewhat less susceptible. Furthermore, the use of FTIR spectroscopy to analyze the structure of proteins in the dehydrated, amorphous state was validated employing bovine pancreatic trypsin inhibitor as a model protein. The results obtained by analysis of the amide III IR spectra were in excellent qualitative agreement with those derived by Desai et al. [33] employing a completely unrelated spectroscopic technique, high-resolution H/D exchange NMR spectroscopy. It was also found for this protein, that the magnitude of the dehydration-induced structural changes depended on the mode of dehydration. Some dehydration methods (e.g., rotory evaporation) produced more structural alterations than others (e.g., lyophilization). Similarly, Costantino et al. [24] found that different methods of dehydration caused different magnitude of structural changes in human albumin. These results are in good agreement with the early predictions of Kunz and Kauzmann [59].
Finally, Figure 9 summarizes all results of the quantitative determination of the dehydration-induced protein structural changes in the last few years. It is obvious that all but one protein underwent the same structural perturbations: the a-helix content decreased and the b-sheet content increased upon dehydration. A possible explanation for this observation may lay in the differences in the amount and strength with which water is bound to a-helices and b-sheets in proteins. Analyzing the X-ray structures of various proteins Barlow and Poole [8] found that water is frequently bound to the peptide backbone in a-helices. Here, it forms quite strong “good” hydrogen bonds. Thus, when this water is removed one should expect structural changes driven by the unsatisfied hydrogen bonding potential. It is therefore not surprising that all proteins with a high a-helix content are quite susceptible to dehydration-induced structural changes. For b-sheets the authors found less bound water forming weaker hydrogen bonds with the protein backbone. Thus, proteins containing mainly b-sheet secondary structure should be less susceptible towards dehydration-induced structural alterations. Again, this is in agreement with the experimental results. For example, immunoglobulin G, a protein with a b-sheet content of more than 60% and no a-helix secondary structure, is thus far the only protein reported to be completely stable towards dehydration [27].
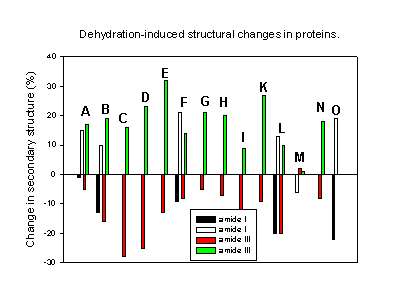
Figure 9. Changes in the secondary structure (a-helix and b-sheet content) for various proteins caused by dehydration (mainly lyophilization).
A. Chymotrypsinogen (amide I [1], amide III [43],
B. Bovine pancreatic trypsin inhibitor [43],
C. recombinant human albumin [43],
D. myoglobin [43],
E. horse heart cytochrome c [43],
F. Subtilisin Carlsberg [44],
G. Ribonuclease A [43],
H. Zn-insulin [43],
I. Interferon [60],
K. Hen egg-white lysozyme [24],
L. Recombinant human growth hormone (amide I, [18] amide III [26]),
M. Recombinant humanized immunoglobulin G [27],
N. Recombinant human desoxyribonuclease I [29],
O. Bovine serum albumin [17].
Prevention of lyophilization-induced structural changes in proteins
In the following we present how FTIR spectroscopy can be utilized to quickly select the appropriate additive (also called excipient) to prevent deleterious structural perturbations as the result of dehydration. Such structural changes are frequently the first step leading to the solid-phase aggregation of proteins [23]. Such solid-phase aggregation of proteins can follow covalent (e.g., formation of intermolecular disulfide bonds) or non-covalent pathways. Often, solid-phase aggregation is caused by the sorption of moisture from air and is accordingly called moisture-induced aggregation of proteins [22,64].
In the following we will limit ourselves to covalent aggregate formation by thiol-disulfide interchange. It has been suggested that the first step leading to this detrimental phenomenon involves protein structural perturbations. As the result, disulfide bonds that are buried in the interior of the native protein, become exposed. The sorption of small amounts of moisture as the next step increases the molecular mobility of the dehydrated protein, but does not cause refolding. The exposed and mobile disulfide groups can then react with free thiol groups of cystein residues creating intermolecular disulfide bonds.
However, solid-phase aggregation of proteins can also occur in the absence of moisture in closed vessels, e.g., for recombinant human growth hormone [29]. Prevention of the phenomenon can be achieved by co-lyophilization of the proteins with various excipients, including polyol lyoprotectants [17,18, 28,29,79]. Using FTIR spectroscopy it has been shown that there are likely two mechanisms responsible for the prevention of solid-phase aggregation: structural preservation and increased protein-protein distance in the lyophilized powders.
Let us first consider how FTIR spectroscopy can easily be employed to identify efficient lyoprotectants that ameliorate protein structural perturbations. As already mentioned earlier, FTIR spectroscopy can be utilized to screen for the influence of the mode of dehydration on the structure of proteins. Similarly, this method can be employed to screen for efficient additives in co-lyophilization experiments. Herein, an excipient is added to the aqueous protein solution prior to its lyophilization. This solution is then lyophilized under standard conditions. The different co-lyophilizates are then pressed into KBr-pellets and FTIR spectra obtained. For many excipients their contribution to the collected FTIR spectrum in the amide I spectral region is insignificant. Frequently, they lack IR bands in this spectral region completely. Therefore, the amide I can often be employed without subtracting the spectrum of the additive. In contrast, the amide III band can frequently not be used to analyze the protein structure in the presence of additives. Many additives exhibit significant IR bands in the amide III region. Removal of the additive contribution from the measured spectrum by subtraction is often impossible because the IR spectrum of many additives is different when co-lyophilized with the protein or lyophilized alone. Therefore, typically only the amide I protein spectra are quantitatively analyzed in such applications.
Overall structural differences between the protein in aqueous solution and in the various co-lyophilizates can be quantified by calculation of the correlation coefficient [72,73] or the area overlap [54]. Efficiency of the excipients in co-lyophilization experiments can also be judged excellently by determining the a-helix content of the protein in the various co-lyophilizates [17,18,29,43]. It has been suggested that the a-helix content is a more reliable structural parameter in such investigations. It is possible, that the b-sheet content is inflated by protein-protein contacts in dehydrated protein powders due to the removal of the bulk solvent water upon dehydration [17,18,29,45 ].
Using above quantitative methods, it has been established that lyoprotectants can prevent dehydration-induced protein structural perturbations. Prestrelski et al. [72,73] co-lyophilized various proteins belonging to different structural classes with numerous established lyoprotectants, such as monosaccharides, disaccharides and polyols (e.g., mannitol). The correlation coefficient r revealed that in particular the disaccharide sucrose was efficient in preventing lyophilization-induced structural perturbations. The correlation coefficient r calculated using the native structure as reference, was much closer to 1 for all proteins in the presence of sucrose. However, sucrose (and the other lyoprotectants used) was of varying efficiency for the different proteins. This indicates that specific lyoprotectant-protein interactions may be important in the prevention of structural alterations caused by the dehydration procedure. In addition, there was a clear correlation between prevention of lyophilization-induced structural perturbations and irreversible structural changes in the re-hydrated protein.
Similarly, Costantino et al. [29] found that lyophilization-induced structural perturbations of recombinant human growth hormone (rhGH) were prevented to a varying extent by saccharide and polyol lyoprotectants. In addition, by employing varying ratios of lyoprotectant:protein in combination with secondary structure determination by Gaussian curve-fitting, this work also shed some light onto the mechanism of the prevention of the solid-state aggregation of rhGH under accelerated storage conditions (exposure of the protein to 50oC). Lyophilization without additives resulted in pronounced structural changes for this protein (a decrease from 57% to 29% in the a-helix and increase from 7% to 24% in the b-sheet content). As already mentioned, the a-helix content is a straightforward structural parameter. Indeed, it has been shown in this work that there is a correlation between stabilization of the protein towards solid-state aggregation and structural preservation (demonstrated by a high
a-helix content in the co-lyophilizate). Furthermore, as the second mechanism increased protein-protein distance was proposed. Supportive arguments were derived from samples showing no differences in the a-helix but differences in the b-sheet content. Since the a-helix content as a structural indicator showed that there were no significant differences in the secondary structure of these samples, the differences in the b-sheet content were taken as mainly indicative for variations in the protein-protein distance. The higher the b-sheet content, the more protein-protein contacts in the powders, the more pronounced the solid state aggregation was the final interpretation for these data.
FTIR spectroscopy has recently been used to screen for efficient lyoprotectants for the model protein bovine serum albumin [BSA]. Figure 10 shows the decrease in the
a-helix content upon lyophilization from an aqueous solution at pH 7.3 [data from 17] in the absence (a) and presence of excipients (b-m). It is evident that the efficiencies of the additives varied drastically. Some did not have any stabilizing effect (b), while others nearly completely prevented dehydration-induced structural perturbation [m]. Such structurally improved preparations can then be further employed in many applications. For example, we have been able to employ such structurally improved dry protein powders to achieve encapsulation of proteins with a nearly native secondary structure in biocompatible hydrophobic polymers [17,18]. This exemplifies the relevance of preventing dehydration-induced structural perturbations for the sustained release of proteins from polymer devices.
Figure 10. Efficiency of various lyoprotectants in the prevention of lyophilization-induced structural changes in bovine serum albumin. Bovine serum albumin was lyophilized from a aqueous solution at pH 7.3 in the absence of any additive [a] or at a 1:1 weight ratio with erythrithol [b], sucrose [c], mannitol [d], lactulose [e], xylose [f], fructose [g], lactose [h], xylitol [i], lactitol [j], trehalose [k], glucose [l], and sorbitol [m].
In addition, prevention of lyophilization-induced structural changes is relevant for the area of the so-called non-aqueous enzymology. Enzymes can effectively be used as catalysts in anhydrous organic solvents for synthetic reactions impossible in water
[38,39,55-57,90]. Since the enzymes’ active site has a defined three-dimensional structure, enzymatic catalysis provides advantages such as substrate specificity [88], enantioselectivity [78,89], prochiral selectivity [53], regioselectivity, and chemoselectivity [88]. Thus the use of enzymes has the potential to contribute significantly to a more ecological, economical, and efficient synthetic organic chemistry. In the vast majority of these applications, dehydrated enzyme powders (mostly obtained by lyophilization) are suspended in the solvents.
It has been established recently that important model enzymes employed in these investigations also undergo dehydration-induced structural perturbations [36, 44]. For example, the a-helix content of the serine protease subtilisin Carlsberg decreased from 34% in aqueous solution to 25% in the dry powder upon lyophilization from aqueous phosphate buffer. Suspension of the subtilisin powder in organic solvents did not lead to significant additional structural alterations [44]. In other words, the dehydration process and not the exposure to many organic solvents was what caused the structural perturbations. Such structural perturbations may lead to lower enzyme activity [55]. However, even more important, they are detrimental to some of the significant advantages enzymes have over conventional catalysts (e.g., excellent enantioselectivity for many reactions). Therefore, several additives were tested for their efficiency in preventing lyophilization-induced structural alterations in subtilisin Carlsberg, including trehalose (a disaccharide) and macrocyclic compounds (e.g., methyl-b-cyclodextrin). As the result, we were able to obtain structurally improved enzyme formulations where lyophilization-induced structural alterations were largely prevented. In case of methyl- b-cyclodextrin as the additive, suspension of the enzyme powder in selected organic solvents did not result in additional structural perturbations. In consequence, these structurally improved enzyme formulations had an improved enantioselectivity for a model reaction [K. Griebenow,Y. Diaz-Laureano, A. M. Santos, I. Montanez-Clemente, L. Rodriguez and G. Barletta, submitted to JACS]. This example also highlights the importance and applicability of FTIR spectroscopy to important biotechnological applications.
In light of the above section, it would be important to understand at the molecular level how lyoprotectants work. Then one could predict which one should be efficient. As already pointed out, however, the same lyoprotectant may work excellent with one protein, but insufficient with another one. It is evident from this that it may not be possible to develop one general theory explaining all observations. In line with this unfortunate statement is also the literature: While in one work lyoprotectant-protein hydrogen bonds have been favored to be important for an efficient lyoprotectant [15], another spectroscopic work came to the conclusion that the spectroscopic results were inconclusive [9]. Factors believed to be important for an efficient additive now include a high glass-transition temperature, formation of protein-lyoprotectant hydrogen bonds (water substitution), water concentration around the protein, prevention of phase separation, and more. New experimental strategies are certainly required to shed more light onto this area of research, including experiments on how these lyoprotectants interact with each other in solids without proteins.
Acknowledgements
The authors acknowledge support by NIH-MBRS (S06 GM08102-26S1), NSF-EPSCoR (OSR-9452893), and the University of Puerto Rico (FIPI). We would also express our gratitude to Dr. Reinhard Schweitzer-Stenner (University of Bremen, Germany) for a critical evaluation of parts of this review.
References
- Allison, S.D., Dong, A., and Carpenter, J.F. [1996] Counteracting effects of thiocyanate and sucrose in chymotrypsinogen secondary structure and aggregation during freezing, drying, and rehydration. Biophys. J. 71, 2022-2032
- Arakawa, T., Prestrelski, S.J., Kenney, W.C., and Carpenter, J.F. [1993] Factors affecting short-term and long-term stability of proteins. Advanced Drug Delivery Reviews 10, 1-28
- Arrondo, J.L.R., Muga, A., Castresana, J., and Goñi, F.M. [1993] Quantitative studies of the structure of proteins in solution by Fourier-transform infrared spectroscopy. Prog. Biophys. Molec. Biol. 59, 23-56
- Aviram, I. and Schejter, A. [1972] On the conformation change attending the hydration of lyophilized cytochrome c. Biopolymers 11, 2141-2145
- Baker, L.J., Hansen, A.M.F., Rao, P.B., and Bryan, W.P. [1983] Effects of the presence of water on lysozyme conformation. Biopolymers 22, 1637-1640
- Barlow, D.J. and Poole, P.L. [1987] The hydration of protein secondary structures. FEBS Lett. 213, 423-427
- Bandekar, J. [1992] Amide modes and protein conformation. Biochim. Biophys. Acta 1120, 123-143
- Barlow, D.J. and Thornton, J.M. [1988] Helix geometry in proteins. J. Mol. Biol. 201, 601-619
- Belton, P.S. and Gil, A.M. [1994] IR and Raman Spectroscopic Studies of the Interaction of trehalose with hen egg white lysozyme. Biopolymers 34, 957-961
- Blake, C.C.F., Pulford, W.C.A., and Artymiuk, P.J. [1983] J. Mol. Biol.167, 693-729
- Braiman, M.S. and Rothschild, K.J. [1988] Fourier-transform infrared techniques for probing membrane protein structure. Ann. Rev. Biophys. Biophys. Chem. 17, 541-570
- Burke, P.A., Smith, S.O., Bachovchin, W.W., and Klibanov, A.M. [1989] Demonstration of structural integrity of an enzyme in organic solvents by solid-state NMR. J. Am. Chem. Soc. 111, 8290-8291
- Byler, D.M. and Susi, H. [1986] Examination of the secondary structure of proteins by deconvolved FTIR spectra. Biopolymers 25, 469-487
- Careri, G., Giansanti, A., and Gratton, E. [1979] Lysozyme film hydration events: an IR and gravimetric study. Biopolymers 18, 1187-1203
- Carpenter and Crowe [1989] An infrared spectroscopic study of the interactions of carbohydrates with dried proteins. Biochemistry 28, 3916-3922
- Carrasquillo, K.G., Cordero, R.A., Costantino, H.R., Mummenthaler, M., Hsu, C.C., and Griebenow, K. [1997] Investigations on the solid-state stability of lyophilized recombinant human growth hormone [rhGH]. Abstract published at: Conference on Formulations and Drug Delivery II, La Jolla, California, October 5-8, 1997
- Carrasquillo, K.G., Cordero, R.A., Ho, S., Franquiz, J.M., and Griebenow, K. [1998] Structure-guided encapsulation of bovine serum albumin in poly[DL-lactic-co-glycolic]acid. Pharm. Pharmacoll. Comm. 4, 563-571
- Carrasquillo, K.G., Costantino, H.R., Cordero, R.A., Hsu, C.C., and Griebenow, K. [1999] On the structural preservation of recombinant human growth hormone in a dried film of a synthetic biodegradable polymer. J. Pharm. Sci., in press
- Chan, H.-K., Ongpipattanakui, B., and Au-Yeung, J. [1996] Aggregation of rhDNase occured during the compression of KBr pellets used for FTIR spectroscopy. Pharm. Res. 13, 238-242
- Chirgadze, YU. N. and Nevskaya, N. A. [1976] Infrared spectra and resonance interactions of amide-I vibration of the antiparallel-chain pleated sheet. Biopolymers 15, 607-625
- Chirgadze, YU. N. and Nevskaya, N. A. [1976] Infrared spectra and resonance interactions of amide-I vibration of the parallel-chain pleated sheet. Biopolymers 15, 627-636
- Costantino, H.R., Langer, R. and Klibanov, A.M. [1993] Moisture-induced aggregation of lyophilized insulin. Pharm. Res. 11, 21-29
- Costantino, H.R., Langer, R., and Klibanov, A.M. [1994] Solid-phase aggregation of proteins under pharmaceutically relevant conditions. J. Pharm. Sci. 83, 1662-1669
- Costantino, H.R., Griebenow, K., Mishra, P., Langer, R., and Klibanov, A.M. [1995] Fourier-transform infrared spectroscopic investigation of protein stability in the lyophilized form. Biochim. Biophys. Acta 253, 69-74
- Costantino, H.R., Schwendeman, S.P., Griebenow, K., Klibanov, A.M., and Langer, R. [1996] On the secondary structure and aggregation of lyophilized tetanus toxoid, J. Pharm. Sci. 85, 1290-1293
- Costantino, H.R., Nguyen, T.H., and Hsu, C.C. [1996] Fourier-transform infrared spectroscopy demonstrates that lyophilization alters the secondary structure of recombinant human growth hormone. Pharm. Sci. 2, 229-232
- Costantino, H.R., Andya, J.D., Shire, S.J., and Hsu, C.C. [1997] Fourier-transform infrared spectroscopic analysis of the secondary structure of recombinant humanized immunoglobulin G. Pharm. Sci. 3, 121-128
- Costantino, H.R., Chen, B., Griebenow, K., Hsu, C.C., and Shire, S.J. [1998] Fourier-transform infrared spectroscopic investigation of the secondary structure of aqueous and dried recombinant human deoxyribonuclease I. Pharm. Pharmacoll. Comm. 4, 391-395
- Costantino, H.R., Carrasquillo, K.G., Cordero, R.A., Mummenthaler, M., Hsu, C.C., and Griebenow, K. [1998] The effect of excipients on the structure and stability of lyophilized recombinant human growth hormone [rhGH]. J. Pharm. Sci. 87, 1412-1420
- Cutmore, E. A. and Hallam, H. E. [1969] Molecular configuration and interactions of the amide group – I Solvent effects on vibrational frequencies. Spectrochim. Acta 25A, 1767-1784
- De Jongh, H.H.J., Goormaghtigh, E., and Ruysschaert, J.-M. [1996] The different molar absorptivities of the secondary structure types in the amide I region: An attenuated total reflectance infrared study on globular proteins. Anal. Biochem. 242, 95-103
- Desai, U.R. and Klibanov, A.M. [1995] Assessing the structural integrity of a lyophilized protein in organic solvents. J. Am. Chem. Soc. 117, 3940-3945
- Desai, U.R., Osterhout, J.J., and Klibanov, A.M. [1994] Protein structure in the lyophilized state: A hydrogen isotope exchange/NMR study with bovine pancreatic trypsin inhibitor. J. Am. Chem. Soc. 116, 9420-9422
- Dong, A., Huang, P., and Caughy, W. [1990] Protein secondary structures in water from decond-derivative amide I infrared spectra. Biochemistry 29, 3303-3308
- Dong, A., Prestrelski, S.J., Allison, S.D., and Carpenter, J.F. [1995] Infrared spectroscopic studies of lyophilization and temperature-induced protein aggregation. J. Pharm. Sci. 84, 415-424
- Dong, A., Meyer, J.D., Kendrick, B.S., Manning, M.C., and Carpenter, J.F. [1996] Effect of secondary structure on the activity of enzymes suspended in organic solvents. Arch. Biochem. Biophys. 334, 406-414
- Dousseau, F. and Pézolet, M. [1990] Determination of the secondary structure of proteins in aqueous solutions from amide I and amide II infrared bands. Comparison between classical and partial least-square methods. Biochemistry 29, 8771-8779
- Faber, K. and Riva, S. [1992] Enzyme-catalyzed acyl transfer. Synthesis, October 1992, 895-910
- Faber, K., Ottolina, G., and Riva, S. [1993] Selectivity-enhancement of hydrolase reactions. Biocatalysis 8, 91-132
- Fu, F.-D., DeOliveira, D.B., Trumble, W.R., Sarkar, H.K. and Singh, B.R. [1994] Secondary structure estimation of proteins using the amide III region of Fourier transform infrared spectroscopy: application to analyze calcium-binding-induced structural changes in calsequestrin. Appl. Spectr. 48, 1432-1441
- Fu, K., Griebenow, K., Hsieh, L., Klibanov, A.M., and Langer, R. [1999] FTIR characterization of the secondary structure of proteins encapsulated within PLGA microspheres. J. Contr. Rel., in press
- Görne-Tschelnokow, U., Naumann, D., Weise, C., and Hucho, F. [1993] Secondary structure and temperature behavior of acetylcholinesterase. Studies by Fourier-transform infrared spectroscopy. Eur. J. Biochem. 213, 1235-1242
- Griebenow, K. and Klibanov, A.M. [1995] Lyophilization-induced reversible structural changes in proteins. Proc. Natl. Acad. Sci. USA 92, 10969-10976
- Griebenow, K. and Klibanov, A.M. [1997] Can conformational changes be responsible for solvent and excipient effects on the catalytic behavior of subtilisin Carlsberg in organic solvents? Biotechnol. Bioeng. 53, 351-362
- Griebenow, K. and Klibanov, A.M. [1996] On protein denaturation in aqueous-organic but not in pure organic solvents. J. Am. Chem. Soc. 118, 11695-11700
- Haris, P.I., Chapman, D., and Benga, G. [1995] A Fourier-transform infrared spectroscopic investigation of the hydrogen-deuterium exchange and secondary structure of the 28-kDa channel-forming integral membrane protein [CHIP28]. Eur. J. Biochem. 233, 659-664
- Heimburg, T. and Marsh, D. [1993] Investigation of secondary and tertiary structural changes of cytochrome c in complexes with anionic lipids using amide hydrogen exchange measurements: An FTIR study. Biophys. J. 65, 2408-2417
- Hildebrandt, P., Griebenow, K., Holzwarth, A.R., and Schaffner, K. [1991] Resonance Raman spectroscopic evidence for the identity of the bacteriochlorophyll c organization in protein-free and protein-containing chlorosomes from Chloroflexus aurantiacus. Z. Naturforsch. 46C, 228-232
- Jackson, M. and Mantsch, H.H. [1995] The use and misuse of FTIR spectroscopy in the determination of protein structure. Crit. Rev. Biochem. Mol. Biol. 30, 95-120
- Kabsch, W. and Sanders, C. [1983] Dictionary of protein secondary structure: Pattern recognition of hydrogen-bonded geometrical features. Biopolymers 22, 2577-2637
- Kaupinnen, J.K., Moffatt, D.J., Cameron, D.G., and Mantsch, H.H. [1981] Noise in Fourier self-deconvolution. Appl. Optics 20, 1866-1879
- Kaupinnen, J.K., Moffatt, D.J., Mantsch, H.H., and Cameron, D.G. [1981] Fourier-selfdeconvolution: A method for resolving intrinsically overlapped bands. Appl. Spectr. 35,271-276
- Ke, T., Wescott, C.R., and Klibanov, A.M. [1996] Prediction of the solvent dependence of enzymatic prochiral selectivity by means of structure-based thermodynamic calculations. J. Am. Chem. Soc. 118, 3366-3374
- Kendrick, B.S., Dong, A., Allison, D., Manning, M., and Carpenter, J.F. [1995] Quantitation of the area of overlap between second-derivative amide I infrared spectra to determine the structural similarity of a protein in different states. J. Pharm. Sci. 85, 155-158
- Klibanov, A.M. [1997] Why are enzymes less active in organic solvents than in water? Trends in Biotechnol. 15, 97-101
- Klibanov, A.M. [1990] Asymmetric transformations catalyzed by enzymes in organic solvents. Acc. Chem. Res. 23, 114-120
- Klibanov, A.M. [1989] Enzymatic catalysis in anhydrous organic solvents. TIBS 14, 141-144
- Krimm, S. and Bandekar, J. [1986] Vibrational spectroscopy and conformation of peptides, polypeptides, and proteins. Adv. Prot. Chem. 38, 181-364
- Kuntz, I.D. and Kauzmann, W. [1974] Hydration of proteins and polypeptides. Adv. Prot. Chem. 28, 239-345
- Lam, X.M., Costantino, H.R., Overcashier, D.E., Nguyen, T.H., and Hsu, C.C. [1996] Replacing succinate with glycolate buffer improves the stability of lyophilized interferon-gamma. Int. J. Pharm.142, 85-95
- Lee D.C., Haris, P.I., Chapman, D., and Mitchell, R.C. [1990] Determination of protein secondary structure using factor analysis of infrared spectra. Biochemistry 29, 9185-9193
- Le Tilly, V., Sire, O., Alpert, B., and Wong, P.T.T. [1992] An infrared study of 2H-bond variation in myoglobin revealed by high pressure. Eur. J. Biochem. 205, 1061-1065
- Levitt, M. and Greer, J. [1977] Automatic identification of secondary structure in globular proteins. J. Mol. Biol. 114, 181-293
- Lui, W.R., Langer, R., and Klibanov, A.M. [1991] Moisture-induced aggregation of lyophilized proteins in the solid state. Biotechnol. Bioeng. 37, 177-184
- Mantsch, H. H., Casal, H. L., Jones, R. N. [1986] Resolution enhancement of infrared spectra of biological systems. In: Spectroscopy of Biological Systems, Clark, R. J. H., Hester, R. E. [eds.]. Wiley, New York, pp. 1-46
- Nevskaya, N. A. and Chirgadze, YU. N. [1976] Infrared spectra and resonance interactions of amide-I and II vibrations of a-helix. Biopolymers 15, 637-648
- Olinger, J.M., Hill, D.M., Jakobsen, R.J., and Brody, R.S. [1986] Fourier transform infrared studies of ribonuclease in H2O and 2H2O solutions. Biochim. Biophys. Acta 869, 89-96
- Poole, P.L. and Finney, J.L. [1983] Hydration-induced conformational and flexibility changes in lysozyme at low water content. Int. J. Biol. Macromol. 5, 308-310
- Poole, P.L. and Finney, J.L. [1983] Sequential hydration of a dry globular protein. Biopolymers 22, 255-260
- Poole, P.L. and Finney, J.L. [1984] Sequential hydration of dry proteins: a direct difference IR investigation of sequence homologs lysozyme and a-lactalbumin. Biopolymers 23, 1647-1666
- Prehoda, K.E., Mooberry, E.S., and Markley, J.L. [1998] Pressure denaturation of proteins: evaluation of compressibility effects. Biochemistry 37, 5785-5790
- Prestrelski, S.J., Tedischi, N., Arakawa, T., and Carpenter, J.F. [1993] Dehydration-induced conformational transitions in proteins and their inhibition by stabilizers. Biophys. J. 65, 661-671
- Prestrelski, S.J., Arakawa, T., and Carpenter, J.F. [1993] Separation of freezing- and drying-induced denaturation of lyophilized proteins using stress-specific stabilization. Arch. Biochem. Biophys. 303, 465-473
- Pribic , R., van Stokkum, I.H.M., Chapman, D., Haris, P.I., and Bloemdal, M. [1993] Protein secondary structure from Fourier transform infrared and/or circular dichroism spectra. Anal. Biochem. 214, 366-378
- Rupley, J.A. and Careri, G. [1991] Protein hydration and function. Adv. Prot. Chem. 41, 37-172
- Rupley, J.A., Gratton, E., and Careri, G. [1983] Water and globular proteins. TIBS, Jan. 1983, 18-22
- Sarver, R.W. and Krueger, W.C. [1991] Protein secondary structure from Fourier transform infrared spectroscopy: A data base analysis. Anal. Biochem. 194, 89-100
- Schoffers, E., Golebiowski, A., and Johnson, C.R. [1996] Enatioselective synthesis through enzymatic asymmetrization. Tetrahedron 52, 3769-3826
- Schwendemann, S.P., Costantino, H.R., Gupta, R.K., Siber, G.R., Klibanov, A.M., and Langer, R. [1995] Stabilization of tetanus and diphteria toxoids against moisture-induced aggregation. Proc. Natl. Acad. Sci. USA 92, 11234-11238
- Singh, B.R., Fuller, M.P., and Schiavo, G. [1990] Molecular structure of tetanus neurotoxin as revealed by Fourier transform infrared and circular dichroic spectroscopy. Biophys. Chem. 46, 155-166
- Singh, B.R., DeOliveira, D.B., Fu, F.-N., and Fuller, M.P. [1993] Fourier transform infrared analysis of amide III bands of proteins for the secondary structure estimation. SPIE 1890, Biomol. Spectr. III, 47-55
- Singh, B.R., Fu, F.-N., and Ledoux, D.N. [1994] Crystal and solution structure of superantigenic staphyloccocal enterotoxins compared. Struct. Biol. 1, 358-360
- Surewicz, W. and Mantsch, H.H. [1988] New insight into protein secondary structure from resolution-enhanced infrared spectra. Biochim. Biophys. Acta 952, 115-130
- Surewicz, W.K., Szabo, A.G., and Mantsch, H.H. [1987] Conformational properties of azurin in solution as determined from resolution-enhanced Fourier-transform infrared spectra. Eur. J. Biochem. 167, 519-523
- Tanaka, N., Nishizawa, H., and Kunugi, S. [1997] Structure of pressure-induced denatured state of human serum albumin: a comparison with the intermediate in urea-induced denaturation. Biochim. Biophys. Acta 1338, 13-20
- Torii, H., Tatsumi, T., Kanazawa, T., and Tasumi, M. (1998) Effects of intermolecular hydrogen-bonding interactions on the amide I mode of n-acetylacetamide: matrix-isolation infrared studies and ab initio
molecular orbital calculations. J. Phys. Chem. B 102, 309-314. - Wang, Y., Purrello, R., Georgiou, S., and Spiro, T.G. [1991] UVRR spectroscopy of the peptide bond. 2. Carbonyl H-bond effects on the ground- and excited-state structures of N-methylacetamide. J. Am. Chem. Soc. 113, 6368-6377
- Wescott, C.R. and Klibanov, A.M. [1994] The solvent dependence of enzyme specificity. Biochim. Biophys Acta 1206, 1-9
- Wescott, C.R., Noritomi, H., and Klibanov, A.M. [1996] Rational control of enzymatic enantioselectivity through solvation thermodynamics. J. Am. Chem. Soc. 118, 10365-10370
- Wong, C.-H. and Whitesides, G.M. [1994] Enzymes in Synthetic Organic Chemistry. Pergamon Press, Oxford
- Yang, W.-J., Griffiths, P.R., Byler, M.D., and Susi, H. [1985] Protein conformation by infrared spectroscopy: Resolution enhancement by Fourier self-deconvolution. Appl. Spectr. 39, 282-287
- Yu, N.-T. and Jo, B.H. [1973] Comparison of protein structure in crystals and in solution by laser Raman scattering. I. Lysozyme. Arch. Biochem. Biophys. 156, 469-474
Received December 1998, received in revised format January 15th 1999. Accepted 15th January 1999