Spinning samples in FT-Spectrometers

4. Spinning samples in FT-Spectrometers.
Anne De Paepe
University of Southampton
Introduction
Samples for quantitative infrared, near infrared or Raman analysis are frequently very inhomogeneous and/or of asymmetric shape. A typical example is the pharmaceutical tablet – frequently inhomogeneous and even of layered construction, of irregular shape and frequently embossed with figures, letters and a logo. A well established procedure is to rotate the sample in the spectrometer sample area and even when appropriate to translate and rotate so that the point of analysis is scrolled over the whole surface of the specimen. However, recently people have been claimimg that sample rotation is not acceptable in F-T instruments, but is this really true?
Traditionally, Raman spectroscopists have rotated samples very rapidly (typically 3000 rpm) but the reason for doing so is not averaging but rather the elimination of sample heating. Many years ago, when the laser was introduced as a source for Raman spectroscopy, sample burning appeared as a real problem.
If the sample absorbs the laser radiation, the very high brightness of illumination and the typically low thermal conductivity of the sample results in an extremely rapid rise in temperature and in many cases the sample burns! Even when sample absorption is only small (the extinction coefficient is small) some heating always occurs and this has been discussed in IJVS [1].
Avoiding sample burning
A problem notoriously associated with FT Raman spectrometers is that the laser heats the sample to an unknown and uncontrollable degree. Hitting the sample with 0.5 W at 1.064 m m for a poor scatterer is not at all unusual. Assuming the illuminated patch at the sample is 300m m in diameter, a fairly typical value, the brightness of illumination exceeds 700 W/cm2. When samples do not classically absorb the radiation, the temperature rises 30 or 40 ° C in typical cases. This usually doesn’t cause any problems unless of course the sample has a low melting point. An example is shown in Figure.1. When pharmaceutical A powder is illuminated with 0.5 W of laser power, the powder melts (TM = 37 ° C) as can be seen in the bottom spectrum.
Figure 1 Spectra of pharmaceutical A.
In the top spectrum, the sample is rotated.
In the bottom spectrum the sample is stationary.
In the top spectrum, the same powder was hit with 0.5W but now the powder, held in an NMR tube, was rotated.
In Figure 2, the same two spectra are displayed only on a different scale in order to show the effect of melting in the stationary spectrum.
Figure 2 Spectra of pharmaceutical A.
In the top spectrum, the sample is rotated.
In the bottom spectrum the sample is stationary.
As can be seen, rotating the sample dissipates the heat and allows one to record spectra of low temperature melting compounds with a considerable amount of laser power. There are many other examples e.g. in catalytic or inorganic chemistry where some absorption of the radiation occurs. In biomedical samples the problem is particularly severe.
A good example in inorganic chemistry is NiSO4.xH2O. Figure 3 shows the effect of sample rotation to avoid laser heating. In the bottom spectrum, the sample is stationary and the heating is clearly present. In the midddle and top spectra the heating effect has vanished, the residual broad peaks near 5900 cm-1 absolute wavenumber, are not due to heating but arise from OH vibrations in the water of crystallisation.
Figure 3 Spectra of NiSO4.xH2O.
In the bottom spectrum the sample is stationary.
In the middle spectrum, the sample is rotated.
In the top spectrum, the sample is rotated and translated.
To avoid these OH vibrations, we tried the same experiment using anhydrous FeCl3 and the effect is shown in Figure 4. Oddly enough the band is more intense when the sample is rotated. This must be due to the bleaching of the fluorescence when the sample is stationary. When the sample is rotated, there is no bleaching, hence the fluorescence increases again (bleaching, or the disappearence of the fluorescence, occurs when a sample is illuminated by the laser for a certain time period).
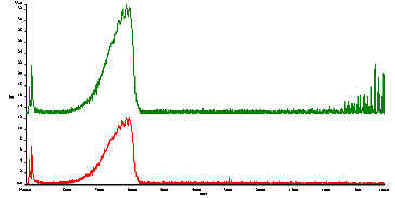
Figure 4 Spectra of FeCl3.
In the bottom spectrum the sample is stationary.
In the top spectrum, the sample is rotated.
Fourier Transform Raman
But there can be a problem; fast rotation, combined with Fourier transform spectroscopy, whether it be infrared Raman or near infrared, leads to the appearance of spurious lines due to so-called ‘modulation’ and ‘double modulation’ of the scattering (or non-absorbed light in the case of the IR or NIR) of the sample. An example is shown in Figure 5. Where a maleic acid tablet is rotated at ~1600 rpm. In the top spectrum, the tablet is stationary, the bottom spectrum is that of the rotating sample.
Figure 5 Spectra of a tablet, consisting of maleic acid.
In the top spectrum, the sample is stationary.
In the bottom spectrum the sample is rotated.
Note that the data is not presented in the familiar wavenumber shift, but in absolute wavenumbers. The Nd-YAG laser (n 0 = 9394 cm-1) excites a Raman spectrum between ~10,000 and ~6000 cm-1. Beyond this frequency, the detector ceases to function hence no real bands appear from 6000 to 400 cm-1. Thus, the spurious lines that appear in the MIR are due to modulation, caused by rotation of the sample. The periodic variations in scattering (or absorption) are Fourier transformed by the instrument processor and appear to the instrument like emission bands in the IR. In fact we are using the Fourier process to frequency analyse the signal from the detector.
However, when rotational frequencies are kept low, these spurious bands fall well outside the relatively restricted range typical of the Raman spectrum and hence no harm will have been done in rotating the sample [2]. It must be stressed that there was no mechanical coupling between the rotor and spectrometer.
Now, there is another problem associated with sample rotation. Assume we are looking at a sample with a single strong Raman or infrared band in its spectrum. This single frequency will generate a cosine function in the interferogram which the processor will then convert into a Raman band. Let’s work through an example:
the laser wavelength is ~1 micrometer = 10,000 cm-1 = n 0
assume we have a Raman frequency at D n = 2000 cm-1 , resulting in Raman band (Stokes) at 8000 cm-1 or 1.25 m m wavelength.
This Raman band generates a cosine function as the interferometer is scanned, as can be seen in Figure 6.
Figure 6 Interferogram after transformation of a single frequency at ~ 8000 cm-1.
Assume, that the instrument scans with 0.1 cm/s, then the audio frequency of this signal will be 0.1cm/s / 1.25*10-4cm or 800 Hz. To put it another way – if you put on headphones and connected the leads across the output leads of the detector preamplifier, you would hear a high pitched whistle as the spectrum is scanned.
Now let us rotate the sample at 100Hz or 6000 rpm. Rotation of the specimen will generate a cosine at 100Hz, which in our example will transform to a band in the MIR at 1000 cm-1. In addition, the new frequency will interact with the Raman one, generating weaker cosine functions at 800 ± n*100 Hz.
The primary additional bands will be the most important ones, producing an interferogram like in Figure 7.
Figure 7. Effect of sample rotation near the actual Raman frequency.
These cosine functions will transform to (see Figure 8):
Figure 8 Effect of sample rotation near the actual Raman frequency
(in absolute wavenumbers and wavenumber shift).
Thus, rotation will inevitably introduce spurious peaks in the Raman spectrum and hence is not acceptable. Recently, Salzer et al [3] suggested the use of step scan measurements in order to eliminate the appearance of these spurious bands. But is this incredibly expensive solution really needed? A couple of years ago, Ventacon Ltd devised a simple rotator for Nicolet instruments (at the suggestion of Dr. Chris Petty), able to hold an NMR tube and designed to rotate slowly, with the intention that by so doing the problems described above would be avoided. The accessory in its Perkin-Elmer guise is shown in Figure 9.
Figure 9. NMR tube rotator and battery supply
Rotation is adjustable in the range 20-50 rpm hence any periodicities in Raman intensities will produce spurious line at less than 1 Hz, which will be very close to the Raman bands themselves and probably cause little or no problem.
We show this in Figure10 where the top spectrum is that of crystalline KMnO4, stationary. In the bottom spectrum KMnO4 powder is rotating. As you can see the problem is not severe. Samples like KMnO4 are particularly sensitive to the double modulation problem because they show very intense and sharp bands.
Figure 10 Spectra of a KMnO4 powder.
In the top spectrum, the sample is stationary.
In the bottom spectrum the sample is rotated.
In addition to periodic variations caused by rotation, the crystals themselves will be illuminated by the laser for short periods of varying lengths. Let us look at this a little closer. The laser beam is about 300 m m in diameter. The permanganate powder particles average about 100m m in size. Figure 11 shows the NMR tube, filled with powder, rotating at 40 rpm.
Figure 11 Top view of a rotating NMR tube,
filled with a powder. L : laser
Linear speed at radius 2 mm = 2*p *2mm * 40/60s = 8.4 mm/s
Thus, the total Raman scattering will rise and fall rather like that displayed in Figure 12.
Figure 12. Periodic variations in the Raman scattering due to particle size.
Hence, the crystallites will produce random spurious bands near the Raman frequencies at ± ~28 Hz.
As expected, when the sample is both rotated and translated, the actual spectrum displays more noise than when only rotating (since the overall noise is proportional to the area under the total spectrum). A picture of the commercially available NMR tube rotator and translator is shown in Figure 13.
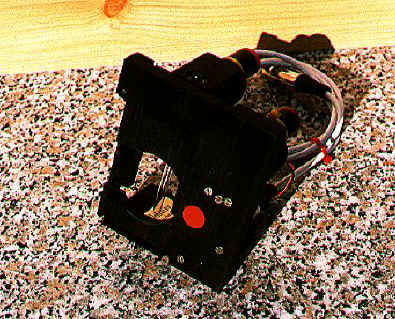
Figure 13. NMR tube rotator and translator.
When speeds of rotation and translation are varied continuously the noise level due to the appearance of spurious side bands is similar to that when the sample is just rotating, but we have the advantage of a bigger sample coverage. It must be said that this noise level is still very low, signal to noise being : 280/0.5 ~ 560, fairly typical of the performance of our instrument.
Averaging
Another advantage provided by rotation is that the spectrum is averaged over the whole area illuminated and this applies equally to IR and Raman.
An example of a machine capable of averaging the Raman spectra over a relatively large sample area is shown in Figure 14.
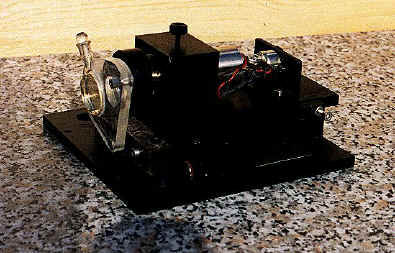
Figure 14. Tablet analyser
Using this device the Raman spectrum of an active in a complete pharmaceutical tablet (complete with logo and identification letters) can be recorded reliably and used to measure the quantity of active present.
Conclusions
Spinning samples provides an excellent means of avoiding problems of sample overheating. Secondly, it overcomes problems associated with inhomogeneous samples. When rotational speeds are kept low (below ~ 1500 rpm) the rotational peaks stay well away from the actual spectrum the increase in noise in the spectrum is negligible. Both rotating and translating samples in order to increase the sampled area does increase the noise in the actual spectrum a little, but it provides the advantage of a bigger sample coverage.
References
[1] Y.D. West, IJVS, Vol. 1, Ed. 1
[2] A.T.G. De Paepe, J.M. Dyke, P.J. Hendra and F.W. Langkilde, Spectrochim. Acta A, 53, (1997), 2261
[3] R. Salzer, U. Roland, R. Born and J. Sawatzki, Applied Spectroscopy, 51, 10, (1997), 1471
Figure 9. Ventacon Sample Rotator, Model SR-2 and D-4 Battery Supply.
Figure 13. Ventacon Sample Rotator, Model SR-5
Figure 14. Ventacon Pharmaceutical Tablet Analyser, Model T-1
Details available on these products, on Fax: + 44 1962 776390 (UK)