Some thoughts on Catalysis and the use of IR & Raman in its study
The Editor
There is absolutely no doubt that vibrational spectroscopy has been a prime analytical tool in heterogeneous catalysis for half a century but dare I suggest that in a way this is a little surprising.
In heterogeneous catalysis reactants are passed over a catalytically active surface usually but not always heated well above ambient and as if by magic, the desired products are produced. [I will always remember that my organic tutor at University back in the 1950’s – a man very classical in his views, always used to mutter -” any fool can shove a gas down a hot tube and get a load of old rubbish out the end”]. Modern catalytic systems when operated at precise temperatures under carefully purified reactants at controlled pressures can produce desired reactions with precision and at very high throughput. These processes are the heart of the large-scale chemical industry if only because they are flow systems and not batch procedures.
In investigating these reactions and in devising new systems the nature of the reactants, the products, temperature pressures and flow rates are all easy to control and monitor. What is really hard is to actually see the reaction(s) itself. The reactants sorb to the surface. At reactive sites rearrangements, decomposition or addition occurs and the products usually vacate the surface very rapidly. As a consequence, exactly as is the case in non-catalytic processes where the activated complex is completely transitory, the reacting species at the surface are there in only minute concentration i.e. they are hard or impossible to study.
There is a large range of methods available for the detailed analysis of surfaces and some are listed in the table below.
| Pressure Range | Method | Information gained |
| Several Atmospheres → 10-10 atmos | IR | Molecular Structure |
| Raman | Molecular Structure but at very low pressures need SERS | |
| As above | Scanning Tunneling Microscopy | Shape of molecules on well defined surfaces |
| Not too far from 1 atmos unless surface has chemisorbed species on it | NMR | Very detailed molecular structure |
| Very low pressures over clean surfaces | Variety of electron spectroscopies and Molecular Spectroscopy | Usually elemented analysis and/or valency state. Rarely molecular structure. |
Table 1. Some of the methods available to study surfaces.
If our quest is to analyse the molecular species involved it seems to be absolutely obvious that the analytical procedure must operate at sensible pressures (from say ½ → 20 atmospheres) and representative temperatures (RT → 100K) because only then will the reaction under study be typical of what it is that we are hoping to achieve. Under this set of constraints, infrared and Raman spectroscopies appear to be ideal because you can heat and pressurise and actually ‘look’ at the surfaces whilst they are reacting. However, the view is naïve – the concentration of active sites and even worse the concentration of reacting species on the surface is swamped by the unreacted reactants and generated products. So where do we go from here?
The examination of clean highly characterised surfaces such as single crystals to which are sorbed sub-monolayers of reactive gases or vapours must obviously be far more likely to yield results of significance on catalytic processes. The problem is that by definition there is almost nothing to examine! To give you an idea: assuming our technique examines 1 sq cm of surface, a monolayer of benzene lying flat on the surface would weigh only 8 micrograms and the thickness of the layer would be ~ 1 angstroms. If we wish to carry out a simple transflectance measurement the sample thickness would be ~2 angstroms i.e. ~10-5 of the conventional infrared pathlength. If one planned to try Raman the sample size is absurdly small. So the outlook looks bleak but not disastrously so.
Once the performance of infrared spectrometers had improved sufficiently it was demonstrated that it was possible to observe incredibly weak bands. If multi-reflection techniques were devised and/or glancing reflection resorted to, the effective path length in these cases could be raised. Infrared experimenters as early as the 1970’s were able to study CO over metal crystal surfaces and the field has expanded from there very rapidly.
Raman is obviously not attractive – its lack of sensitivity and the minute sample volume inevitable with such a thin specimen make the method impracticable. However, the SERS effect can enhance the spectrum by 106or much more in favourable cases and so SERS is a technique with immense potential* success has already been achieved – see reference 1.
* Readers should consult the Special Edition on SERS published last year.
Many catalysts are highly porous. Compounds such as silica aluminas or zeolites have huge areas to which molecules can sorb. In microporous materials the holes may be of molecular size and limit access to sites nearer the surface, but the surface area of these materials can be huge indeed – values of 100 → 1000m2g-1 are not unusual. Sorbing a monolayer to these materials does provide a decent amount of material and so vibrational spectroscopy started with this type of catalyst system. Pioneers such as Norman Sheppard adsorbed methane to silicas and using infrared were able to show how the molecules interacted. The selection rules dictate that the bands expected for I are not the same as for II or III.
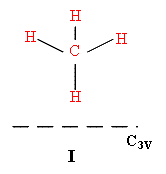
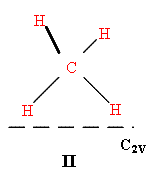
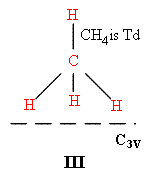
—– = surface
Whilst the sorbtion process will alter the strength and hence the ‘rigidity’ of the CH bands lowering their vibrational frequencies.
This approach is half a century old but still vitally important. The experimental methods available have improved but the analysis is based on the same logic. Perhaps the main limitation with this method is that the predominant species must always be the support and hence the spectrum of the adsorbate must overlie that of the catalyst itself.
Silica based materials absorb strongly in the 1000-1500cm-1region so as a result much of the ‘fingerprint’ region is obliterated. Non crystalline and partially crystalline ceramics often have very weak Raman spectra so it is obvious that monolayer coverages of good Raman scatters over porous surfaces might well be accessible. They are and pioneering data appeared as early as 1970 but the field was dogged by fluorescence. The mere act of baking the catalyst under vacuum to drive off water and contaminants prior to sorbing the molecule of interest could produce astronomic levels of fluorescence. The problem was eventually traced to oil and grease in the vacuum system and was tamed but as a field of study, Raman has not been nearly as significant as infrared.
So – if the study of molecules sorbed directly to surfaces is of considerable fundamental interest, but tricky to do, what other measurements are of value? Catalysts are frequently highly heterogeneous and their preparation may well be complex and chemically rather obscure e.g. highly significant catalysts such as those used in vehicle exhaust systems involve tiny clusters of metal atoms supported on a porous ceramic material. The methods by which these materials are produced are of very considerable commercial importance. The best method of production can well result in market domination. In general, the ceramic is treated with a solution of the metal(s) as salts or as organometallics.
Once dried and often roasted, the catalyst is then frequently reduced using H2 or cracked ammonia generating the desired clusters of metal atoms. Vibrational spectroscopy has been remarkably successful in following the reactions involved. Most of the competing surface analytical techniques are relatively unattractive on these incredibly complex heterogeneous mixtures.
Zeolite and silica alumina catalysts have a variety of acidic sites on their surfaces. They may contain surface OH groups (I) or Lewis acid acceptor sites (II)
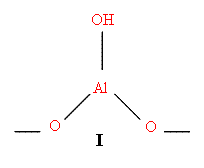
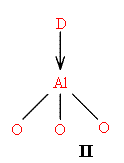
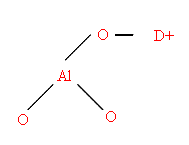 D = Donor Molecule
or even Bronsted acid sites allowing proton abstraction III.
The performance of the catalyst is frequently dominated by the relative and absolute density of these sites on the surface. This is another area where vibrational spectroscopy is unequally valuable. The trick is to use a tell-tale molecule. Ammonia has always been popular but pyridene can also be used. Let us take pyridene as an example.
Liquid pyridene shows its ring breathing mode at 990cm-1. Pyridene/water mixtures show a band near 1000cm-1. The pyridene cation vibrates still faster whilst coordination of pyridene to a metal pushes the frequency into the 1025cm-1area. Quite obviously, if one sorbs the pyridene to the catalyst and runs the spectrum, the nature of the species and their relative distribution can quickly be measured. The example I give is based on Raman bands but infrared is just as useful, but relies on bands at much higher frequencies. This type of surface assay is routinely used to characterise and/or monitor catalysts. You can be even more clever – the actual frequency of the tell-tale molecule vibration is closely related to the strength of the adsorbate – adsorbent interaction. So a careful analysis of the band shape can yield data on the distribution of activities of a specific type of site e.g. the Lewis acid activity on a cracking catalyst. See ref 2.
All surface scientists concern themselves with the adsorption isotherm. The subject is covered in all classical Physical Chemistry textbooks, but let me over simplify. In many examples of porous catalysts, the plot of the amount of material absorbed vs. the pressure over the system is shown below.
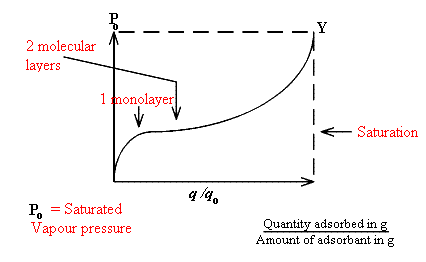
Monolayer coverage coincides with the sharp downward bend in the curve. Above this level, sorption produced multi-layers and eventually liquid trapped in the pores until at Y free liquid wets the catalyst. Surface scientists measure these isotherms and can make much of their shape. Since vibrational spectroscopy is applied to samples in enclosed cells at controlled temperatures, spectra can be recorded at precisely known points on the isotherm. This is particularly and almost unequally valuable in both fundamental and applied work.
So – vibrational spectroscopy is valuable because of its enormous versatility. Haven’t I heard that before somewhere?
References
- N.J.Ortinis, T.A. Kruger & P.J.Dutta, Anal. Applies of Raman Spect. Ed., M.J. Pelletier Blackwell Science Oxford 1999 and refs contained therein.
- R. Ferwerda, J.H. van der Maas & P.J. Hendra, J. Phys. Chem, 97, 7331 (1993)
REF: P.J. Hendra. Int. J. Vib. Spect., [www.irdg.org/ijvs] 5, 2, 4 (2001)

