An FT-IR Microscopic Based Imaging System: Development and Applications for Chemical Analysis

5. AN FT-IR MICROSCOPIC
BASED IMAGING SYSTEM:
Development and Applications for Chemical Analysis
Norman A. Wright
Bio-Rad,
Spectroscopy Division,
237 Putnam Avenue,
Cambridge, MA 02139
U.S.A.
Email: Norman_Wright [at] bio-rad.com">Norman_Wright [at] bio-rad.com
Keywords: imaging, spectroscopy, chemical analysis, mid-infrared
Introduction
This paper provides an overview of an infrared spectroscopic imaging system along with some applications. The technique combines the emerging commercially available technology of focal plane array (FPA) detectors with a step-scan Fourier transform (FT) Michelson interferometer based spectrometer. This coupling provides an optimized method for infrared spectroscopic imaging by simultaneously realizing both a multiplex and multichannel advantage. Specifically, the multiple detector elements enable spectra from all pixels to be collected simultaneously, while the interferometer allows all the spectral frequencies to be measured concurrently. This technique can rapidly generate very high quality, chemically specific images from a wide variety of samples. Early systems were built for special purpose applications. Among these were airborne gas analysis [1,2] and astronomical observation [3]. The instrumentation described here is specifically oriented to chemical analysis.
Infrared microscopy is a tool that lends itself to the examination of heterogeneous samples. Using microscopy a researcher can more easily investigate a sample for defect analysis, domain identification or boundary information. Mapping techniques have been developed for infrared microscopes to expand the capabilities of and ease of use when studying this spatial nature of samples. However, creating a map becomes a time consuming task if both high spatial resolution and high signal to noise is required. Even with the current level of sophistication available in infrared mapping systems, this fundamental limitation cannot be overcome. A mapping system cannot generate, in a reasonable time frame, sufficient data to reconstruct an image with high spatial content as well as good signal-to-noise.
Infrared imaging is the logical replacement of infrared mapping when the need to spatially characterize a sample is required. With array detectors covering suitable spectral regions, this capability is now available. Samples can be viewed either in transmission or reflection and no staining or coating is required. The technique is non-destructive and works well for solids and liquids. The contrast that is seen in these images arises from the inherent infrared absorption of the sample, i.e.; every chemical compound has its own characteristic absorption pattern that creates an infrared signature.
This paper describes the instrumental components of the Bio-Rad FTS Stingray 6000 infrared imaging system configured for microanalysis (shown in Figure1), and a sampling of applications of this emerging powerful analytical tool.
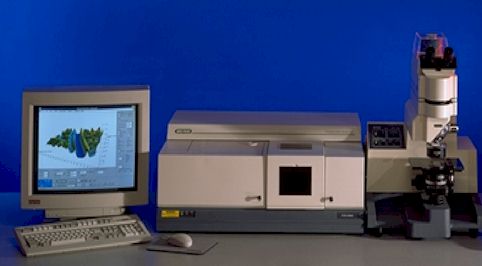
Figure 1. The Bio-Rad FTS 6000 Spectrometer with an MCT Array Detector Mounted on a UMA500 Infrared Microscope
Experimental Set Up
A review of focal plane array detectors and their potential for spectroscopic applications is discussed by Colarusso, et. al. [4]. While much of the current effort in developing focal plane technology is being carried out in the area of uncooled arrays, the LN2 cooled arrays are more sensitive and in general, better suited for spectroscopy.
The initial laboratory description of this technique (5) used a cooled InSb 128 x 128 pixel array detector. The detector has a spectral response window between 3 and 5 micrometers. This allowed collection of data in the narrow spectral region between 4000 and 2000 cm-1.
Because of the natural interest in mid-infrared spectral information, an MCT array detector was located for this application. The detector is a 64×64 pixel MCT array, with a spectral window of 2.3 to 11 microns (ca. 4000 – 900 cm-1), which was developed for the Javelin missile program for the U.S. Army. Repackaged, it represents commercial diversification of military technology.
Both the InSb and MCT FPA detectors provide digitized data output. The data is transferred to a host Windows NT based PC that also controls the FT-IR spectrometer. This simplification of the array detector control electronics has created a system rugged and reliable enough to be considered as a commercial product.
The spectrometer system described here is a Bio-Rad FTS 6000 Infrared spectrometer with a UMA 500 Infrared Microscope. The focalplane array detector is mounted on the microscope. The MCT array detector with its 64 x 64 element array views a sample size of approximately 7 mm x 7 mm per pixel or a 400 mm x 400 mm overall sample size using the standard Bio-Rad 15x microscope objective.
The FTS 6000 spectrometer is operated in step-scan mode for the imaging application. Although the integration time for the FPA is less than a millisecond, due to the time required for readout of the entire array, the use of the step scan mode is necessary. The data from the array detector is transferred directly to memory, via a digital frame grabber card that is installed in the single Windows NT based PC, used to control both the spectrometer and the array detector.
The fixed mirror position of the Michelson interferometer is piezo controlled. This allows the interferometer to maintain continuous alignment as well as establish and maintain discrete optical positions thereby allowing data collection from the focalplane array. The spectrometer has a range of step scans speeds, which allows the user to “sit” at a single optical retardation and co-add multiple frames to improve the signal-to-noise of the resulting spectra. The following diagram shows how the data acquisition is synchronized with the steps of the interferometer.
At each step of the interferometer, defined by the summed motion of the fixed and moving mirrors, the array detector is triggered to collect image frames, one or more per step. As shown below, multiple frames are collected and co-added at each step.
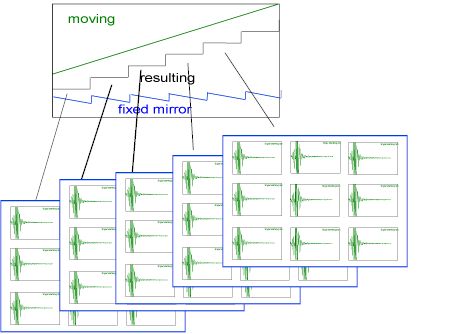
Figure 2. The diagram above shows the motion of the interferometer mirrors, moving and ‘fixed’ which result in step scan performance. At each step, frames of data are collected by the array detector and co-added to improve S/N.
The acquired data is an array of interferograms that following a Fourier transform generates a spectral hypercube. Additional processing includes library searches for unknown compositions and the ability to perform quantitative analysis after calibration or reference correction.
Using this technique we acquire a four dimensional array of data. We have a grid of points over the sample (two spatial dimensions) and at each point on that grid is an infrared spectrum (two additional dimensions — infrared frequency and intensity). We can think of this ‘spectroscopic data hypercube’ in the following ways. First, the data can be thought of as a stack of images of the sample, each obtained at a different infrared frequency. Any card can be pulled out of the stack to ‘see’ what the sample looks like at one particular frequency. Second, an infrared spectrum exists for every point on the sample, and that spectrum can be used to identify a material, or for quantitation (how much is present).
This data is collected in a short time, just a few minutes, and is typically 16-64 MB in size. It can represent over 16,000 spectra, collected at typical analytical spectroscopic resolution, and the individual spectra can be from as small as a 5 mm square area. We obtain an infrared spectrum (a plot of infrared frequency versus energy absorbed) at each pixel, creating a total of 4096 spectra. All the spectra are collected at the same time. The data set can be thought of as a deck of cards. An individual card gives a picture of the sample at one particular infrared frequency (one ‘color’ of infrared radiation). If we drill down through the deck at one particular pixel location, we obtain the infrared spectrum of the sample at that position.
Examples
Two simple examples of this imaging chemical analysis follow. The first example is of a nylon mesh sample. The image shown below is generated from the 3350 cm-1 band (NH stretch). The 3-dimensional image consists of 4096 resolution elements to create the infrared image. The red colour shows the area of highest absorption and the blue area represents no absorption, between the strands. This spectral region is shown selected in the spectrum shown on the right side of the figure. Because the sample consists of a single material, an image at any selected wavelength will result in essentially the same image.
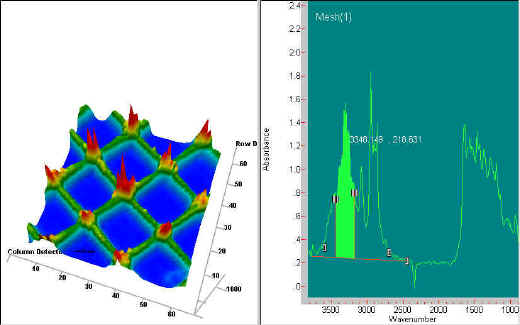
Figure 3. Image of a nylon mesh at 3350 cm-1. The mesh has a spacing of approximately 125 mm. The Spectrum on the right side shows the band from which the image is derived.
The second example of chemical specific imaging is of a three-layer laminate comprised of an epoxy and a urethane component. The differences between the two materials is shown in the following two figures. The laminate is first imaged using the 1414 cm-1 band. This band highlights the edge layers of the laminate. The last figure (Figure 5) shows an image at 1467 cm-1 which highlights the centre layer of the laminate.
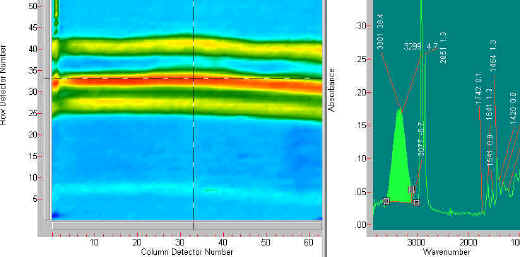
Figure 4. The image on the left side is derived from the 1414 cm-1 band. The spectrum at the right shows that 1414 cm-1 band highlighted. The laminate has outside layers that contain a component with this spectral band.

Figure 5. This figure shows the image created from the 1467 cm-1 band. This image shows that the centre component of the laminate is made of material with a spectral band at 1467 cm-1.
Other Applications
The areas in which infrared imaging has been applied and reported are varied, including biological systems, polymer systems, material defect analysis, agricultural products, and art restoration investigations.
Some specific applications and their references are, silicone leakage from artificial implants in breast tissue[6], primate brain tissue imaging [7,8], biomineralized tissue, distribution in bone sections [9], curing of polymer blends [10], diffusion rates in Liquid crystals [11], and discrimination of co-extruded polymers [12].
Summary
Infrared imaging spectroscopic analysis is an emerging technique that provides chemical specific information as images. From these images, precise information about the chemical composition and material structure of a sample is obtained. This type of information is significant as it allows the investigator to understand more fully a chemically diverse sample, which is generally the rule rather than the exception when studying either made-made or naturally occurring materials. Due to the ease of infrared image generation, and the power of image analysis software tools, the ability to study complex systems is now readily available so that the analysis and applications become the focus rather than the experimental technique itself.
References
- Michael R. Carter, Charles L. Bennett, David J. Fields and John Hernandez, Gaseous effluent monitoring and identification using an imaging Fourier transform spectrometer, in Substance Detection Systems, Proc. SPIE 2092 16-26 (1993).
- Charles L. Bennett, Michael R. Carter and David J. Fields, Hyperspectral Imaging in the Infrared Using LIFTIRS, in Infrared Technology XXI, Proc. SPIE 2552, 274-283 (1995).
- P. Cox, J. P. Maillard, P. J. Huggins, T. Forveille, D. A. Simmons, F. Riaut, R Bachiller, S. Guilloreau, A. Omont, Astron. Astrophys., 1996.
- Pina Colarusso, Linda H. Kidder, Ira W. Levin, James C. Fraser, John F. Arens and E. Neil Lewis, Infrared Spectroscopic Imaging: From Planetary to Cellular Systems, Appl. Spectrosc. 52, 106A-120A (1998).
- E. N. Lewis, P. J. Treado, R. C. Reeder, G. M. Story, A. E. Dowrey, C. Marcott, and I. W. Levin, “FTIR spectroscopic imaging using an infrared focal-plane array detector”, Anal. Chem., 67, 3377 (1995).
- L. H. Kidder, V. F. Kalasinsky, J. L. Luke, I. W. Levin and E. N. Lewis, “Visualization of silicone gel in human breast tissue using new infrared imaging spectroscopy”, Nature Medicine, 3(2), 235-237 (1997).
- E. N. Lewis, A. M. Gorbach, C. Marcott, and I. W. Levin, “High-Fidelity FTIR spectroscopic imaging of primate brain tissue”, Appl. Spectrosc. 50, 263, (1996).
- E. Neil Lewis, Linda H. Kidder, Ira W. Levin, Victor F. Kalasinsky, Joseph P. Hanig and David S. Lester, Applications of Fourier Transfrom Infrared Imaging Microscopy in Neurotoxicity, in Imaging Brain Structure and Function, Annals of the New York Academy of Sciences, 820, 234-247 (1997).
- Curtis Marcott, Robert C. Reeder, Eleftherios P. Paschalis, Dimitris N. Tatakis, Adele L. Boskey and Richard Mendelsohn, Infrared Microspectroscopic Imaging of Biomineralized Tissues using a Mercury-Cadmium-Telluride Focal-Plane Array Detector, Cellular and Molecular Biology, 44, 109-115 (1998).
- Sung Joon Oh and Jack L. Koenig, Phase and Curing Behavior of Polybutadiene/ Diallyl Phthalate Blends Monitored by FT-IR Imaging Using Focal Plane Array Detection, Anal. Chem. 70, 1768-1772 (1998).
- C. M. Snively and J. L. Koenig, Application of Real Time Mid-Infrared FTIR Imaging to Polymeric Systems. 1. Diffusion of Liquid Crystals into Polymers, Macromolecules, 31, 3753-3755 (1998).
- John M.Chalmers, Neil J. Everall, Karen Hewitson, Michael A. Chesters, Martin Pearson, Andrew Grady and Barbara Ruzicka, Fourier transform infrared microscopy: some advances in techniques for characterisation and structure-property elucidations of industrial material, The Analyst, 123, 579-586 (1998).