Use of In Situ Fiber-Optic Raman Spectroscopy to Replace Calorimetry in the Monitoring of Polymer and Composite Curing
Jeffrey F. Aust1, Karl S. Booksh1, Christopher M. Stellman1, Richard S. Parnas2, and Michael L. Myrick1 *
1Department of Chemistry and Biochemistry, University of South Carolina, Columbia, SC 29208.
2Polymers Division,
National Institute of Standards & Technology, Gaithersburg, MD 20899.
* Author to whom correspondence should be addressed. email: Myrick [at] psc.sc.edu
118. Abstract
| A method for real time determination of the percent cure of epoxies via in-situ fiber-optic Raman spectroscopy has been developed. This method utilizes a probe design developed for real time monitoring of polymer curing and multivariate analysis to interpret the data and determine percent cure. This method is demonstrated to be reliable to +/- 0.54% of cure in laboratory samples over a 50-99% cure range. A preliminary study measuring cure percentage in an industrial, glass-reinforced composite has been shown to be reliable to +/- 0.82% in the 40-90% cure range.Key words: Process monitoring, fiber optic, Raman spectroscopy, in-situ, percent cure, composite, chemometrics |
119. Introduction
Several properties of a processed composite depend to a great extent on the chemical properties of the polymer matrix.[1] Monitoring and controlling the chemical reactions associated with the cure percent of polymers is important because poor thermal conductivity coupled with internal heat generation can cause temperature and reaction gradients, runaway exotherms (“hot spots”), and residual thermal stresses. All of these factors can lead to internal damage, poor bonding between matrix and fibers, and premature structural failure of the composite.
Differential Scanning Calorimetry (DSC) is the industry-standard method for determine the cure of a polymer, but it is a labor-intensive method that is also fairly slow (20-30 minutes per sample). Fiber-optic Raman spectroscopy allows for the acquisition of direct bond information and has the capability to monitor curing reactions in situ.[2-6] In previous work, we developed a novel probe for the measurement of sensitive Raman spectra.[7] By measuring spectra throughout the curing of a polymer and using multivariate techniques, we can correlate the patterns of change in the spectra with the DSC results. If this works well, then in principal we may use the in situ Raman method to provide “predictions” of cure in a polymer during processing. The term “prediction” is used in the sense of a prediction of the result one would obtain from the sample if one subjected it to DSC.
120. Experimental
More explicit details of how this measurement were performed are found elsewhere [8] however, to briefly recount the major points:
- A commonly-available epoxy (DGEBA/Jeffamine T-403) and a composite manufactured at NIST were studied.
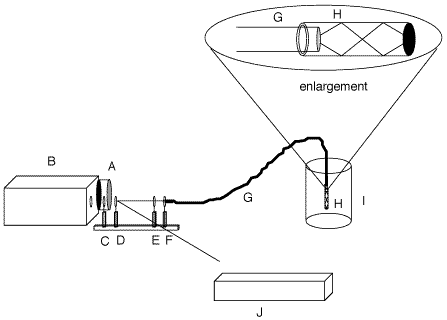 Figure 1: Diagram of the instrumental set-up and in-situ probe. A, CCD Detector; B, spectrograph; C, holographic filter; D, beamsplitter; E, lens; F, ST-connector; G, fiber optic; H, Teflon(r) tube filled with polymer; I, bulk polymer; J, laser w/bandpass filter.
- The measurement apparatus is shown in schematic in Figure 1. Fiber-optics were used to deliver light to the sample and retrieve scattering for measurement. The in-situ measurements of samples were made using a one-fiber Raman system employing a new probe design in which the distal end of the fiber is inserted into a Teflon¤ tube that was previously filled with the epoxy mixture.[7] Excitation of the laboratory samples was achieved by focusing 30 mW of the 488 nm line from a Coherent Innova 305 argon laser onto the proximal end of the fiber with an f/2 lens. The industrial sample used 75 mW of the 488 nm line from a Spectra Physics Series 2000 argon laser. The scattering collected from the distal end was collimated through a 488 nm holographic filter (Kaiser Optical Systems Inc.) to attenuate the excitation line, and the remaining Raman signal was focused onto the slit of a Chromex 250IS imaging spectrograph. A 1200g/mm grating blazed at 750 nm was employed for all runs and was centered at 572 nm (3000 cm-1). The slit width was changed from 50 mm for thin film experiments to 25 mm for the bulk experiments. The slit adjustment was used to control the amount of signal reaching the CCD. The spectra were collected with a thermoelectrically cooled CCD camera (Santa Barbara Instrument Group) modified by the addition of an external water jacket.[9] The detector temperature for the experiments was -50°C.121. The main novelty in the experiment was the use of a novel probe consisting of a teflon sheath filled with the epoxy mixture. This probe provided very large Raman signals with ease, prevented the polymer from cracking at the fiber tip, and provided a clear space filled with sample even in the composite.
- the C-H region of the spectra were studied.
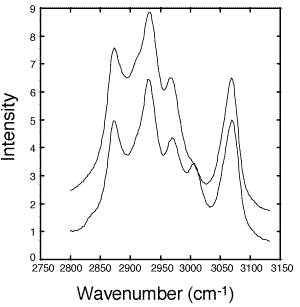
Figure 2: Raw fiber-optic Raman spectra of uncured (solid line) and cured (dashed line) epoxy. Spectra were taken with 30 second exposures and a slit width of 17mm. The laser power was 30 mW.
- Figure 2 shows Raman spectra taken before and after curing the epoxy (DER 332–Jeffamine T-403) sample. The five peaks of interest are assigned in Table I. The C-H region was chosen in this case because the C-F stretches of the Teflon¤ (1400-1200 cm-1) and silica backscatter from the optical fiber overshadow the epoxy ring peaks from 1280-1230 cm-1
- Raman spectra from a thin film sample of the composite epoxy industrial sample were acquired every 5 seconds with 30 mW of laser power and a slit width of 50 mm (5 cm-1 resolution). Spectra were correlated to subsequent DSC measurements to determine the percent cure of the composite.
- Principal Component Analysis is a method that decomposes data sets into a series of patterns that express the changes in those data. The first principal component is the single pattern within the data that accounts for most of the variability of the data. Subsequent PC’s explain less and less variability in the data, until the least significant PC’s explain only noise. When the breakdown of the spectra into PC’s is followed by regression to relate the behavior of those PC’s to chemical or physical changes in the sample, the method is known as Principal Component Regression (PCR).[10,11] PCR was employed in two steps in our experiment: model validation and prediction. For model validation, we decomposed some of the data into PCs and then evaluated the remaining data to see if the PCs found for the first set explained the variability of the second. It was determined that a one principal component (PC) model constructed from mean-centered spectra (each spectrum having the average spectrum subtracted from it) that have been normalized to unit area was optimal for prediction. The model was then used to estimate the percent cure, as defined by DSC, of the bulk samples.
122. Results And Discussion
Laboratory samples
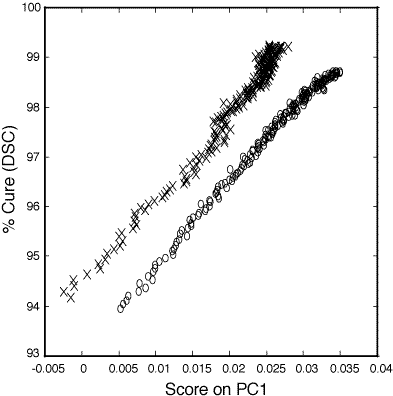
Figure 3: Relationship between PC1 score and percent cure (93-100%) as determined by DSC for the 100:45 pbw (o) and 100:55 pbw (x) DER 332–Jeffamine T-403 thin film epoxy mixtures.
Figure 3 shows the relationship between the score on the first PC (PC1 score) and percent cure as determined from DSC. The data for both the 100:45 parts by weight (pbw) ratio (o) and the 100:55 pbw ratio (x) are linear from 50 to 98+ percent cured. PC1 described 98.7% of the variance about the mean fro the 100:45 pbw polymer samples and 95.7% of the variance about the mean for the 100:55 pbw polymer samples. The subsequent PCs described significantly less variance than PC1 for the two data sets and were not correlated to cure related spectral changes.
123. Calibrations of measurements below 50% cure are unreliable due to the rapid changes in cure percentage at 150°C compared to the time required for spectral acquisition on these thin film samples. Curing at lower temperatures results in a prohibitively long curing process to reach at or least 95% cure. For example, curing of the 100:45 pbw epoxy mixture at 90°C, the temperature at which the bulk samples are started, would require 7 hours to reach 95% cure and 25 hours to achieve 99% cure. The higher cure temperature was chosen to place emphasis on the last 10% of cure. In this region of importance traditional methods do not allow for accurate monitoring. For the 100:45 pbw ratio the standard deviation of errors calculated during the PCR model validation step was 0.27 percent cure. The standard deviation calculated during the PCR model validation step was 0.32 percent cure. This corresponds to 95% confidence limits of 0.54 percent cure and 0.62 percent cure for the two sets of polymers.
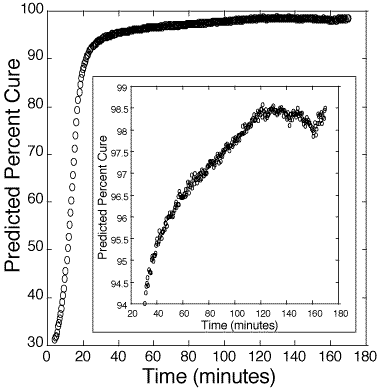
Figure 4: Predicted cure percentages of 100:45 pbw DER 332–Jeffamine T-403 bulk epoxy mixture. Calibration is based on information obtained from figure 3.
124. The variance associated with the correlation of spectral changes is comparable in magnitude to the reproducibility of the DSC measurements. Percent cure as a function of time profiles for five replicate 100:45 pbw samples were analyzed by DSC yielding a standard deviation of 1.1 percent cure between 40 and 60 percent cure and decreasing to a standard deviation of less than 0.2 percent cure over 95 percent cured. This translated to a standard deviation of the mean of less than one part per thousand over 95 percent cured for the DSC data. Clearly, by performing multiple DSC runs, the mean percent cure, to which the Raman spectra are referenced, can be determined to arbitrary precision.
125. Figure 4 presents the estimated cure percentage of a bulk 100:45 pbw epoxy. Figure 5 presents the estimated cure percentage of a bulk 100:55 pbw epoxy. Each figure shows the initial slowness of the reaction until the internal heat generated from the polymerization accelerates the reaction rate.
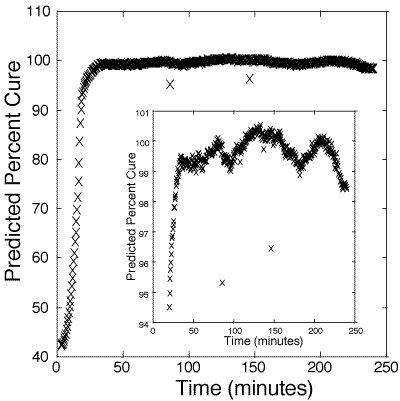
Figure 5: Predicted cure percentages of 100:55 pbw DER 332–Jeffamine T-403 bulk epoxy mixture. Calibration is based on information obtained from figure 3.
At 98-99%, the estimate of per cent cure deviates significantly from the standard sigmoidal curing curve, likely due to internal stresses and cracking of the polymer. At present, there are no other in-situ methods for reliably measuring above 98% cure.[12-14] These results suggest that the probe is a good indicator of catastrophic failure from stress. Hence, one use of this method may be to monitor the cure of polymers up to a critical cure percentage, after which thermal annealing can be used to ease internal stress.
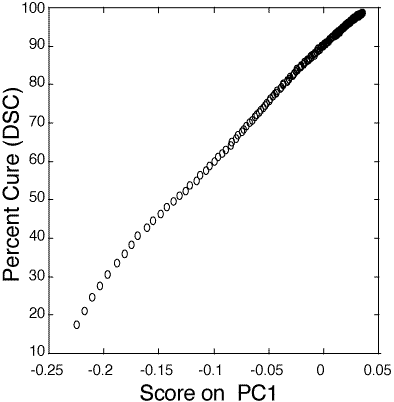
Figure 6: Relationship between PC1 score and percent cure (10-100%) as determined by DSC for the 100:55 pbw Tactix 123–Jeffamine D-400 thin film epoxy mixture.
126. Industrial sample. Figure 6 shows the relationship between PC1 score and percent cure as measured by DSC of the Tactix 123–Jeffamine D-400 epoxide system. The thin film calibration data follows a linear model from 35 to 91+% cured. The standard deviation about the regression, for the range of 40 to 90% cured, is 0.41 percent cure. The determination of percent cure in the industrial sample was not as precise as the laboratory sample mainly due to the fluorescence from surrounding glass fibers and nylon bindings which contributed to a higher background.
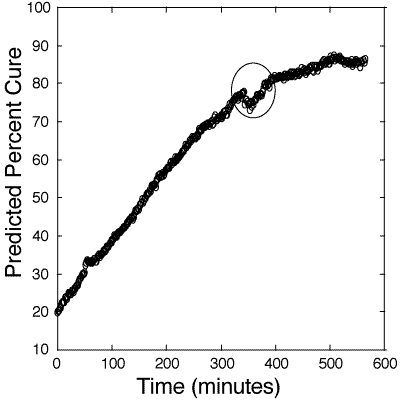
Figure 7: Predicted cure percentages of 100:55 pbw Tactix 123–Jeffamine D-400 glass -reinforced composite epoxy mixture. Calibration is based on information obtained from figure 6. The circle signifies an area of discontinuity due to the stopping, restarting, and acquisition of a new dark frame by the camera.
127. Figure 7 shows the optically-directed curing of the composite at 50oC which was monitored for 10 hours. This industrial bulk composite was much larger than the laboratory bulk samples and the required larger heating system did not allow for higher cure temperatures. The percentage of cure of the composite was derived from the calibration plot of figure 6. One major monitoring discontinuity is evident in the figure occurring approximately 350 minutes into the cure. This was due to the stopping and restarting of the CCD acquisitions in order to reset the memory for overnight monitoring. After the restart, a new dark frame was acquired at a slightly different detector temperature, which probably contributed to this irregularity. A dark frame is the thermal background noise in the detector at a particular temperature. The data acquisition software automatically subtracts this dark frame from each spectrum. In spite of this difficulty, a reasonable process control chart for in-situ monitoring the curing process was obtained.
128. Conclusion
Fiber-optic Raman spectroscopy is an effective method for in-situ analysis of polymers and composites. Percent cure as determined by DSC of laboratory and industrial polymer samples were determined by multivariate analysis to better than +/- 0.52% cure for laboratory samples and +/- 0.82% for an industrial sample. The Raman signal from the probe is altered enough by stress after 99% cure that reliable curing information cannot be derived. Changes in probe design and polymer processing may allow for curing measurements above 99%. Higher mold temperatures, which reduce polymer viscosity and allow a faster injection into the mold, would allow for a more “true” reading from a bulk sample. Design changes in both the probe and injection mold could allow for improved accuracy in curing measurements of the industrial samples.
Acknowledgments
M.L.M, CMS and J.F.A gratefully acknowledge the Army Research Office (Grant Number DAAL03-92-G-0316) and Dr. Edward S. Chen (ARO) for his interest and encouragement.
K.S.B. gratefully acknowledges the National Science Foundation Postdoctoral Fellowship (CHE-9403179).
All authors are especially indebted to Mike McLester for his technical expertise.
129. References
1. D. Hunston, W. McDonough, B. Fanconi, F. Mopsik, F. Wang, F. Phelan and M. Chiang, “Assessment of the State-of-the-Art for Process Monitoring Sensors for Polymer Composites,” Report NISTIR 4514, U.S. Department of Commerce (1991).
2. M.L. Myrick, S.M. Angel, R.E. Lyon and T.M. Vess, Proceedings of the SPE 50th Annual Technical Conference and Exhibits, Detroit, Michigan (1992).
3. C.M. Stellman, J.F. Aust and M.L. Myrick, Appl. Spectrosc. 49, 392 (1995).
4. R.E. Lyon, K.E. Chike and S.M. Angel, J. Appl. Polym. Sci. 53, 1805 (1994).
5. M.L. Myrick, S.M. Angel and R.E. Lyon, SAMPE J. 28, 37 (1992).
6. S.D. Schwab and R.L. McCreery, Appl. Spectrosc. 41, 126 (1987).
7. J.F. Aust, K.S. Booksh, and Myrick, M.L. Appl. Spectrosc. 50, 382 (1996).
8. J.F. Aust, K.S. Booksh, C.M. Stellman, R.S. Parnas and M.L. Myrick Appl. Spectrosc. 51, 247(1997).
9. J.B.Cooper, J.F. Aust, C. Stellman, K.Chike, M.L.Myrick R.Schwartz and M. Longmire, Spectrochim. Acta 50A, 567(1994).
10. D.L. Massart, B.G.M. Vandeginste, S.N. Deming, Y. Michotte, and L. Kaufman, Chemometrics: A Textbook – Volume 2 (Elsevier, Amsterdam, 1988).
11. A. Lorber, L. Wangen, and B.R. Kowalski, J. Chemom. 1, 19 (1987).
12. R.L. Levy, and S.D. Schwab, Polymer Composites 12, 96 (1991).
13. N.H. Sung, W. Dang, and H.J. Paik, Proceedings 36th International SAMPE Symposium 36, 1461 (1991).
14. P.R. Young, M.A. Druy, W.A. Stevenson, and D.A.C. Compton, SAMPE J. 25, 89 (1989).
15. N.B. Colthup, L.H. Daly and S.E. Wiberly Introduction to Infrared and Raman Spectroscopy (Academic Press, Boston, 1990), 3rd Ed.
16. D. Lin-Vien, N.B. Colthup, W.G. Fateley, and J.G. Grasselli. The Handbook of Infrared and Raman Characteristic Frequencies of Organic Molecules (Academic Press, San Diego, 1991).
REF: Int. J. Vib. Spect., [www.irdg.org/ijvs] 1, 4, 117-128 (1997)
